Life Hack Visualization

Life Hack Visualization

Originaldokument

GPT Image 2 · en

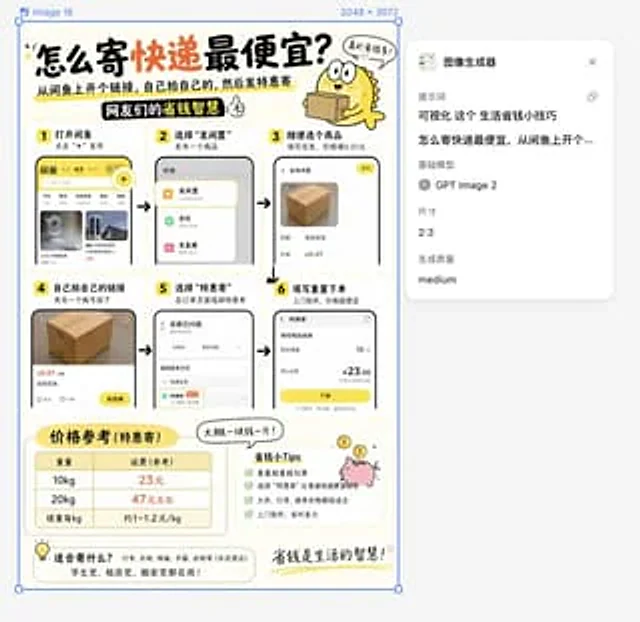
Visualize this content{argument name="topic" default="Money-saving tips for daily life"}{argument name="specific tip" default="How to send a package at the cheapest price: Create a link on Xianyu (a second-hand marketplace), place the order yourself, and then use the discount for shipping. 10 kg costs 23 yuan, 20 kg costs about 47 yuan, which is about 1 yuan per kilogram—a money-saving tip from netizens."}

Verwendung

  1. Den vollständigen Original-Prompt einschließlich Parametern kopieren.
  2. Motiv, Text und Komposition an die eigenen Anforderungen anpassen.
  3. Ein kompatibles externes Werkzeug nutzen; Zugangsbedingungen und Ergebnis prüfen.

Vor dem Start

  • Prüfen, ob ein Referenzbild nötig ist. Kompatibilität belegt nicht das tatsächlich verwendete Modell.
  • Namen, Zahlen und Bildtexte prüfen; Modellversionen können andere Ergebnisse liefern.
Ähnliche Beispiele

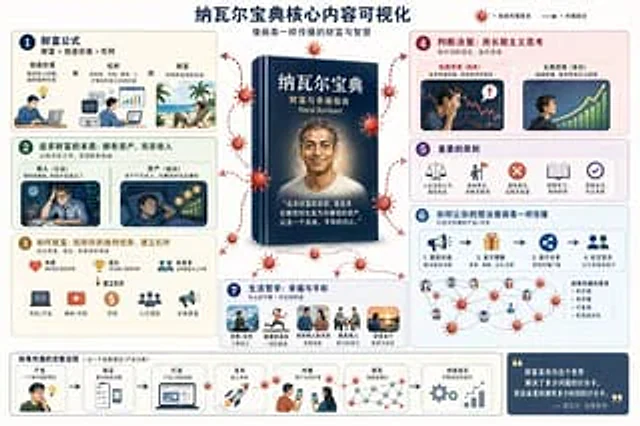
Book Visualization Prompt
GPT Image 2en

Visually demonstrate through specific scene illustrations{argument name="book name" default="The Almanack of Naval Ravikant"} The core content is incorporated with viral marketing elements suitable for social media dissemination.

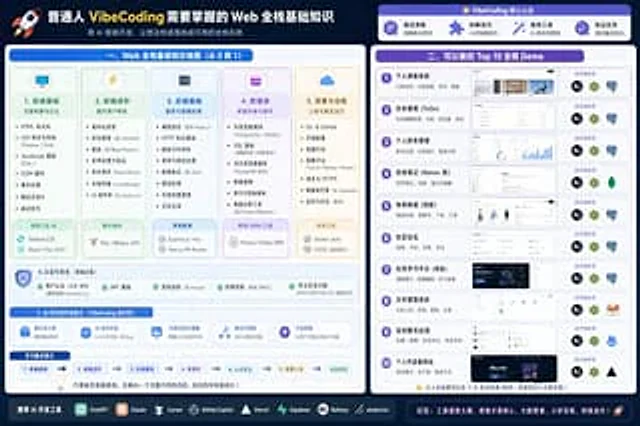
Full Stack Knowledge Visualization
GPT Image 2en

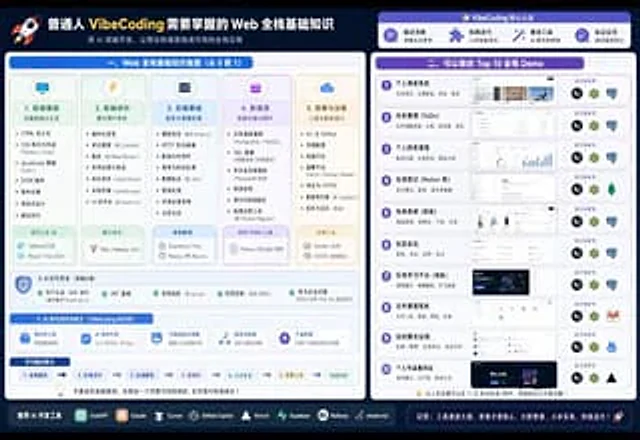
right{argument name="subject" default="Basic Web Full-Stack Knowledge Required for Ordinary People to Perform VibeCoding"} Visual presentations, and what can be created{argument name="count" default="Top 10"} Full-stack project demonstration.

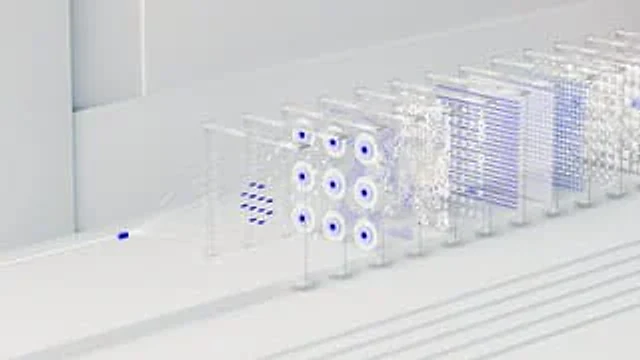
3D Abstract Data Pipeline Visualization
GPT Image 2en

A clean, minimalist 3D rendering that visualizes {argument name="concept" default="Neural Network Data Processing Pipeline"} On the left, a light-emitting {argument name="accent color" default="blue"} The pointed white cable branches into multiple thin, curved white bundles. Thes

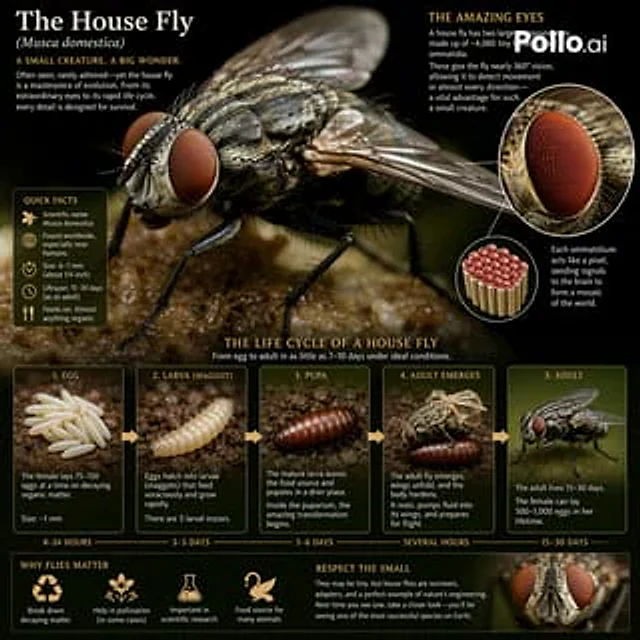
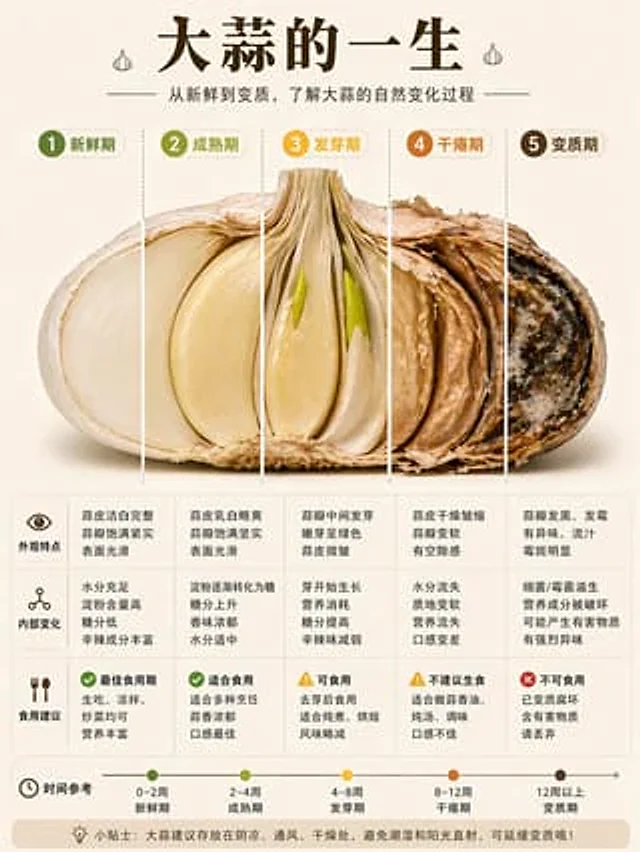
Garlic Life Cycle Infographic
GPT Image 2en

{ "type": "Chinese infographic poster", "topic": "The life cycle of garlic from fresh to spoilage", "style": "Concise, editable food infographics with high information density; high-quality social media science posters; warm, neutral color palette; realistic food cross-sect