PROMPTS · KREATIV ENTDECKEN

Prompt-Galerie

Echte Prompts und erzeugte Beispiele erkunden. Inspiration für Ihre nächste kreative Mission finden und den vollständigen Prompt kostenlos kopieren.

Beispiele
10,950
Modelle
15
Quellen
1269
10.950 Prompt-Beispiele · Seite 81 von 229
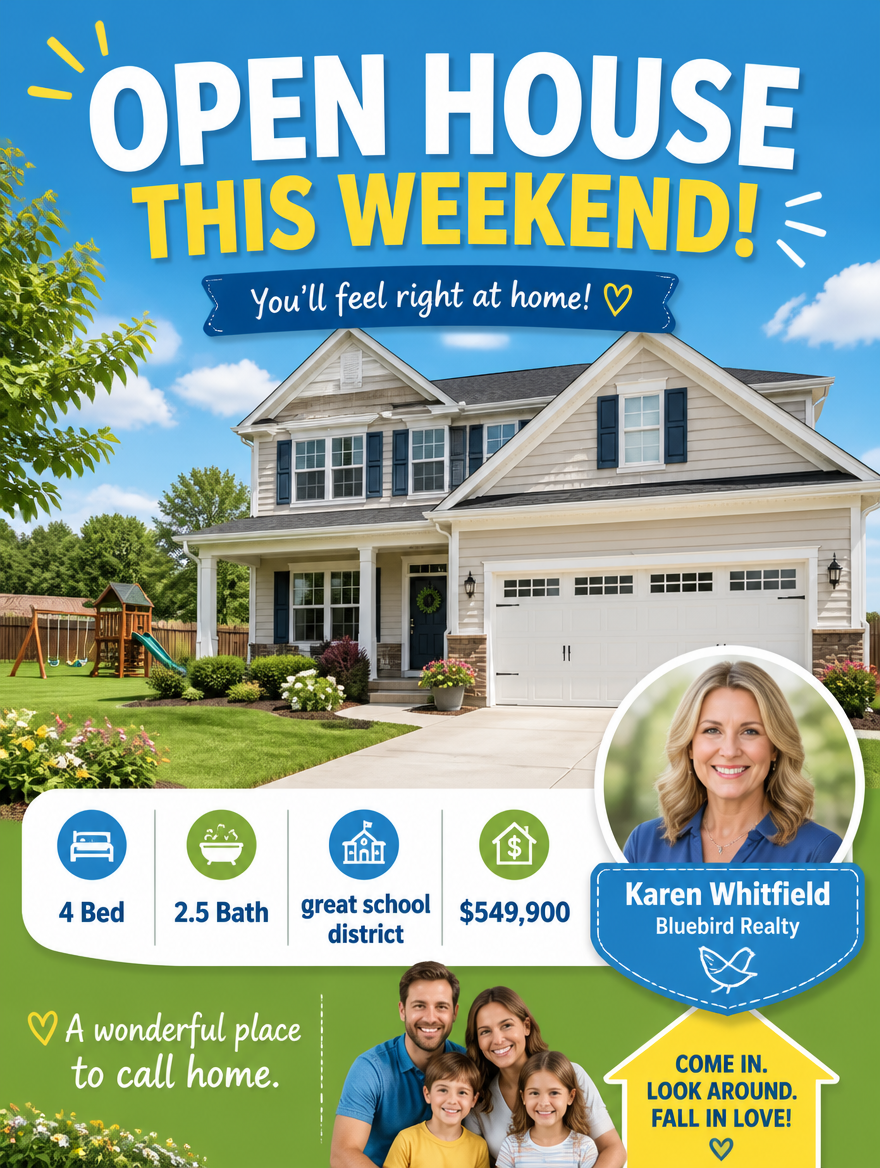
Example generated from “Suburban Family Home”
GPT Image 2en

A bright, family-friendly open-house flyer for a suburban home. A cheerful daytime render of a two-car garage house with a swing set in the backyard and a blue sky. Approachable bold sans reads 'OPEN HOUSE THIS WEEKEND!' A clean spec strip lists '4 Bed · 2.5 Bath · great school district · $549,900.' A photo-circle names 'Karen Whitfield, Bluebird Realty.' Palette of sky blue, fresh green, warm white, sunny yellow. Wholesome, welcoming, family-oriented marketing.
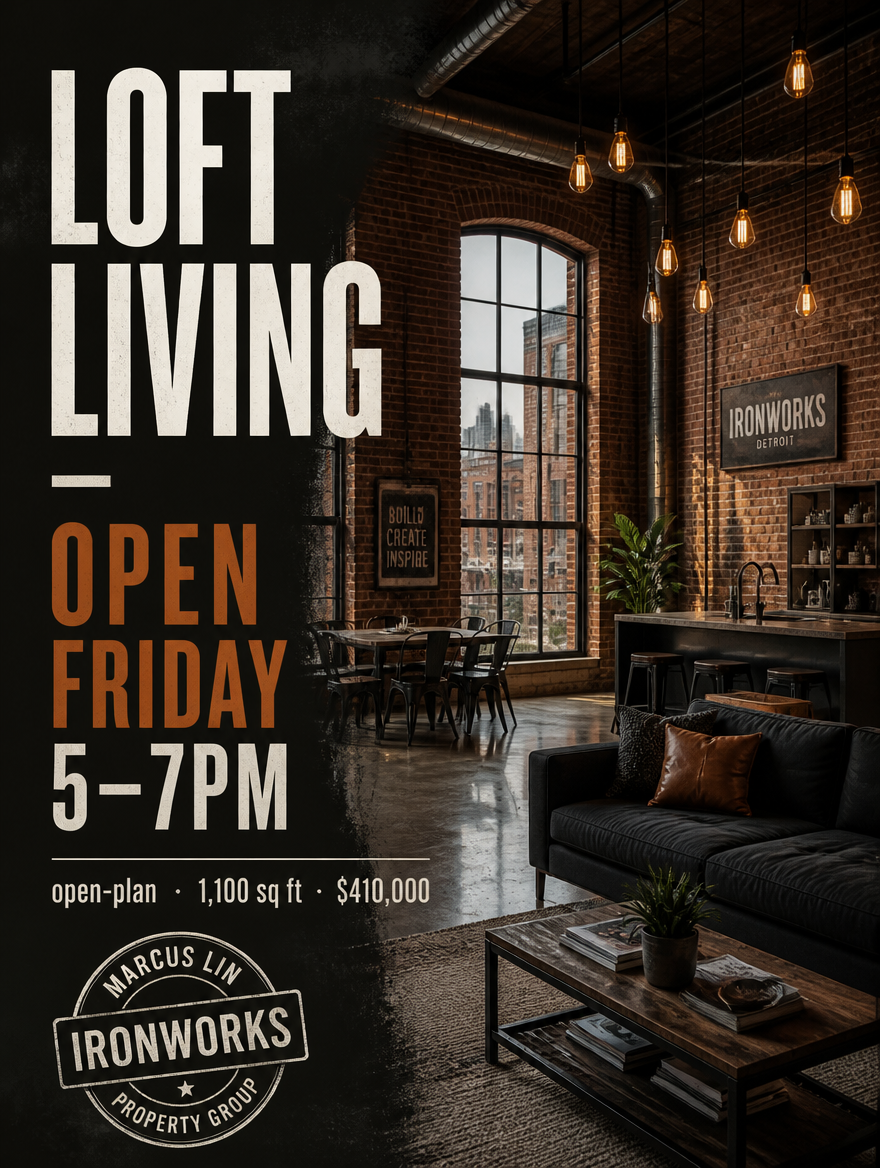

Example generated from “Downtown Loft Space”
GPT Image 2en

A stylish open-house flyer for an urban loft. A moody render of an exposed-brick loft with tall industrial windows, polished concrete floors, and hanging Edison bulbs. Bold uppercase condensed type reads 'LOFT LIVING — OPEN FRIDAY 5–7PM.' A thin rule precedes 'open-plan · 1,100 sq ft · $410,000.' A stamp-style badge names 'Marcus Lin, Ironworks Property Group.' Palette of warm brick, charcoal, amber light, off-white. Trendy, industrial-chic, young-urban appeal.

Example generated from “Just Sold Announcement”
GPT Image 2en

A celebratory 'JUST SOLD' real-estate flyer. A crisp render of a handsome craftsman house with a bold red 'SOLD' rider clipped over a for-sale sign in the yard. Confident bold serif reads 'ANOTHER HOME SOLD!' A clean line notes 'sold in 6 days, above asking.' A round headshot-style badge names 'Elena Farrow, Summit Group Realty' with the tagline 'thinking of selling? let's talk.' Palette of crisp white, deep red, navy, gold. Proud, trustworthy, results-driven agent branding.

Example generated from “Beachfront Property”
GPT Image 2en

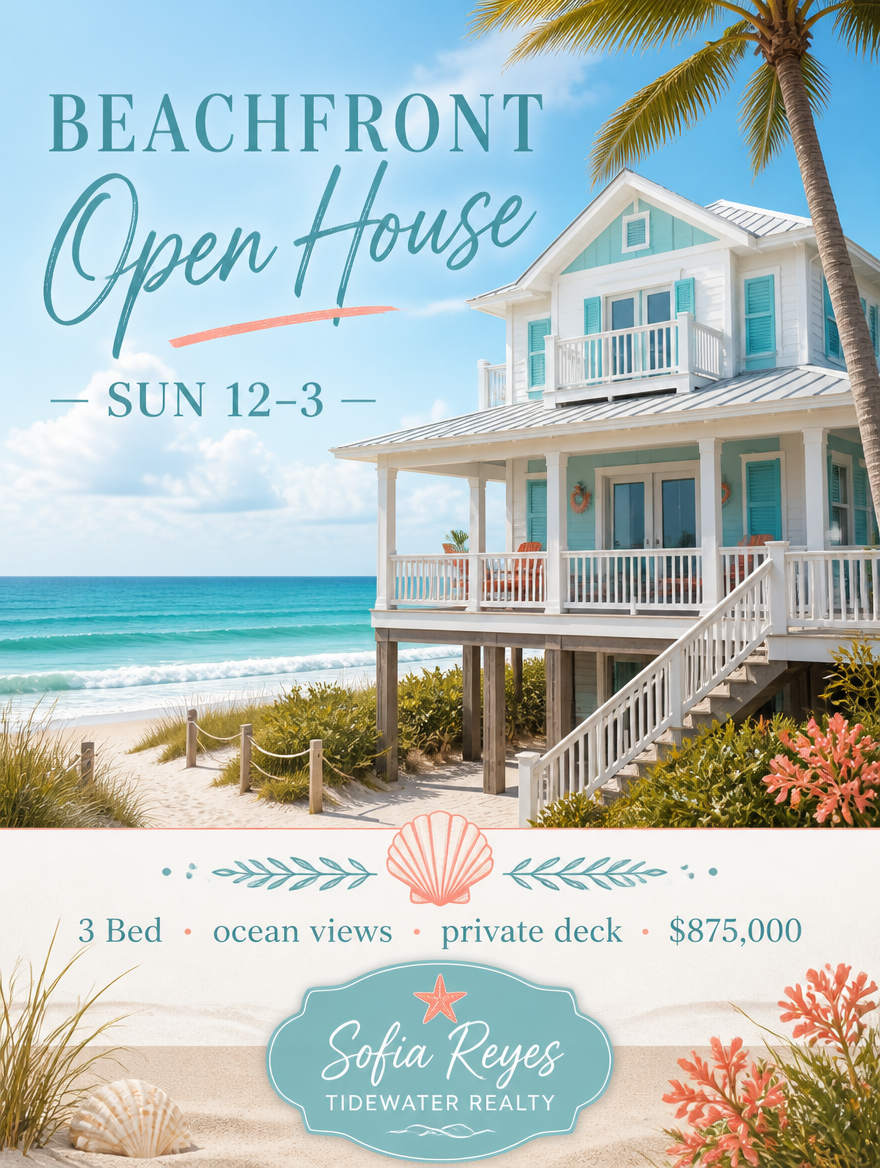
A breezy coastal open-house flyer for a beachfront property. A sunlit render of a white-and-teal beach house on stilts, palm trees, and turquoise ocean behind. Airy light script reads 'BEACHFRONT OPEN HOUSE — SUN 12–3.' A shell-motif divider precedes '3 Bed · ocean views · private deck · $875,000.' A soft badge names 'Sofia Reyes, Tidewater Realty.' Palette of turquoise, sandy beige, white, coral. Relaxed, sunny, dreamy coastal-lifestyle marketing.
Example generated from “Mountain Cabin Retreat”
GPT Image 2en

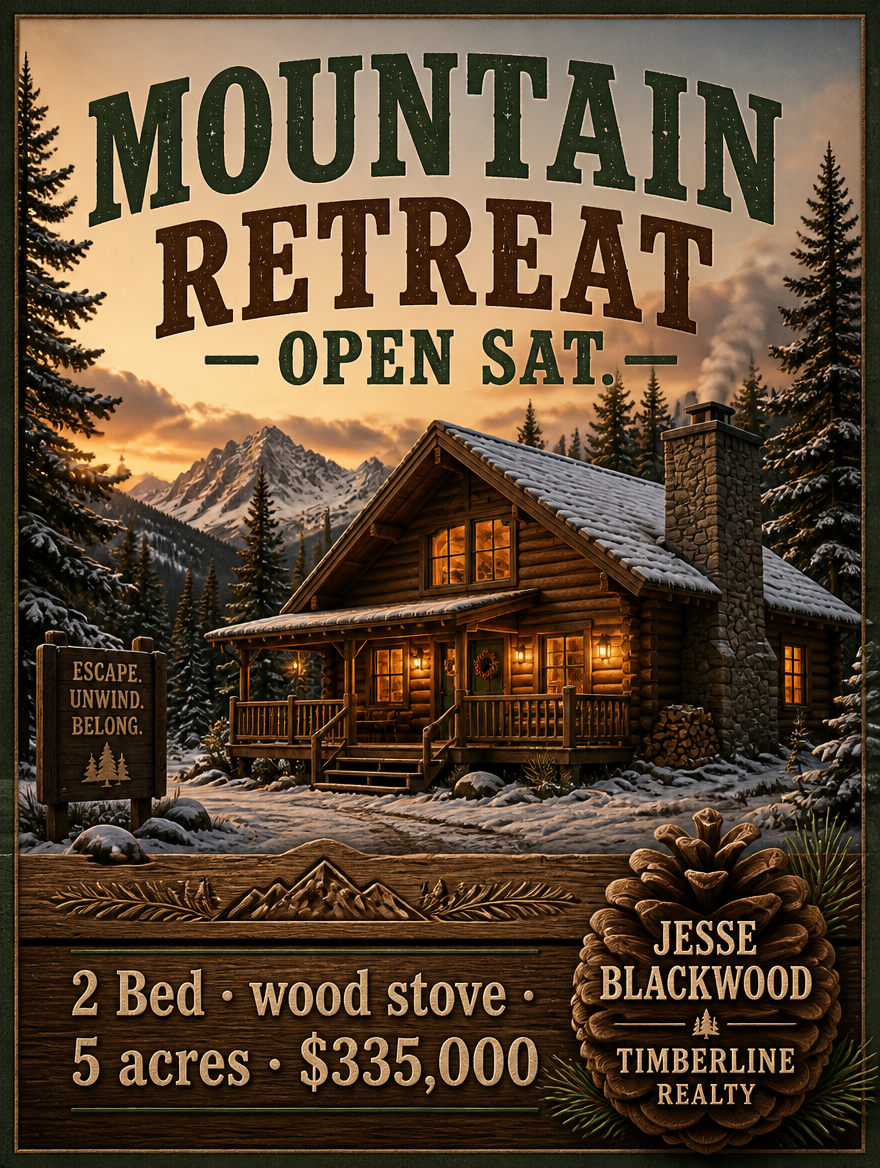
A rustic open-house flyer for a mountain cabin. A warm render of a log cabin nestled among snow-dusted pines with smoke rising from the chimney at dusk. Woodsy slab-serif reads 'MOUNTAIN RETREAT — OPEN SAT.' A carved-wood divider precedes '2 Bed · wood stove · 5 acres · $335,000.' A pinecone badge names 'Jesse Blackwood, Timberline Realty.' Palette of pine green, warm log brown, snow white, amber. Cozy, escapist, rustic-getaway charm.

Example generated from “New Development Preview”
GPT Image 2en

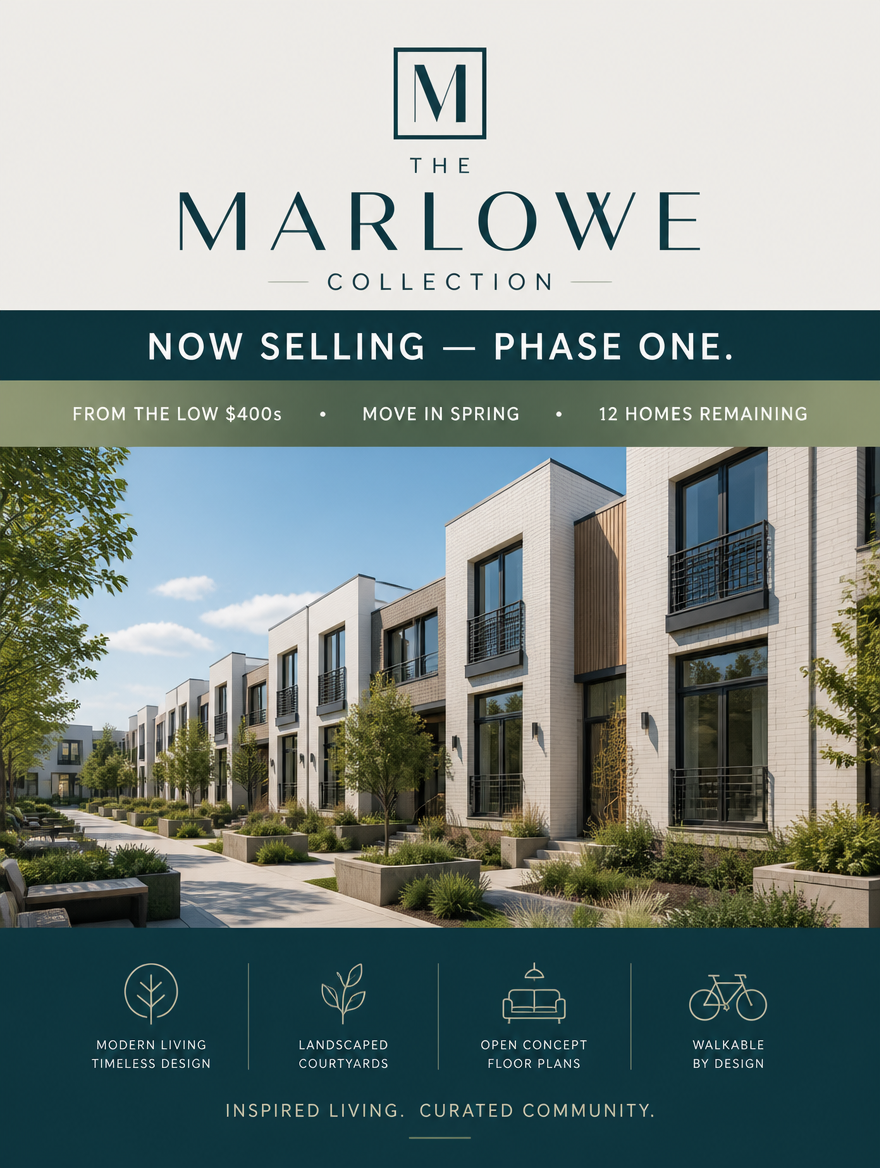
A polished pre-construction real-estate flyer for a new development. A crisp architectural render of a row of modern townhomes with landscaped courtyards and clean geometric facades under a clear sky. Sleek uppercase sans reads 'NOW SELLING — PHASE ONE.' A gradient bar lists 'from the low $400s · move in spring · 12 homes remaining.' A monogram names 'The Marlowe Collection.' Palette of soft grey, sage, warm white, deep teal. Modern, aspirational, developer-grade presentation.

Example generated from “Taco Tuesday Special”
GPT Image 2en

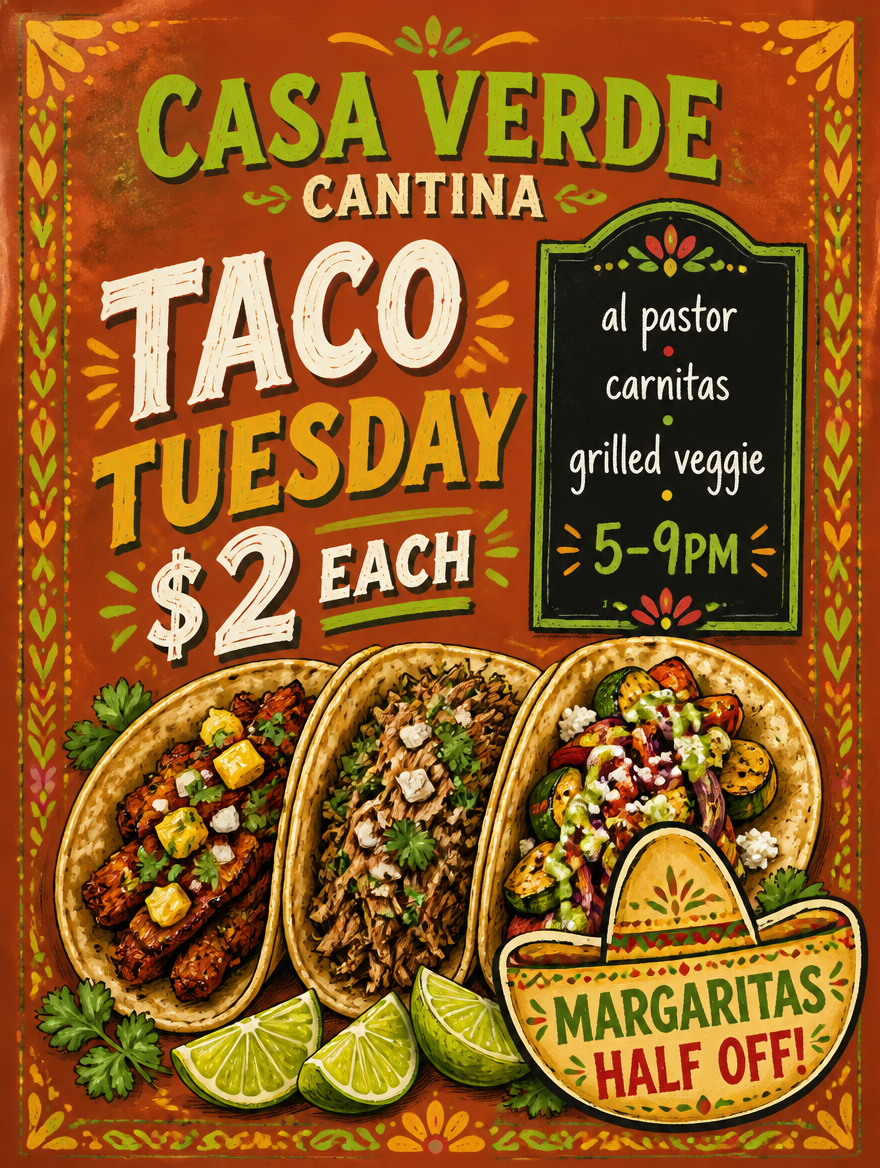
A vibrant restaurant menu-special flyer for 'Casa Verde Cantina.' A hand-drawn illustration of three loaded street tacos with lime wedges and cilantro on a warm terracotta background with painted folk-art borders. Bold festive display type reads 'TACO TUESDAY — $2 EACH.' A chalk panel lists 'al pastor · carnitas · grilled veggie · 5–9pm.' A sombrero-shaped badge notes 'margaritas half off.' Palette of terracotta, lime green, marigold, chili red. Lively, appetizing, festive Latin-eatery energy.

Example generated from “Country Farmhouse Estate”
GPT Image 2en

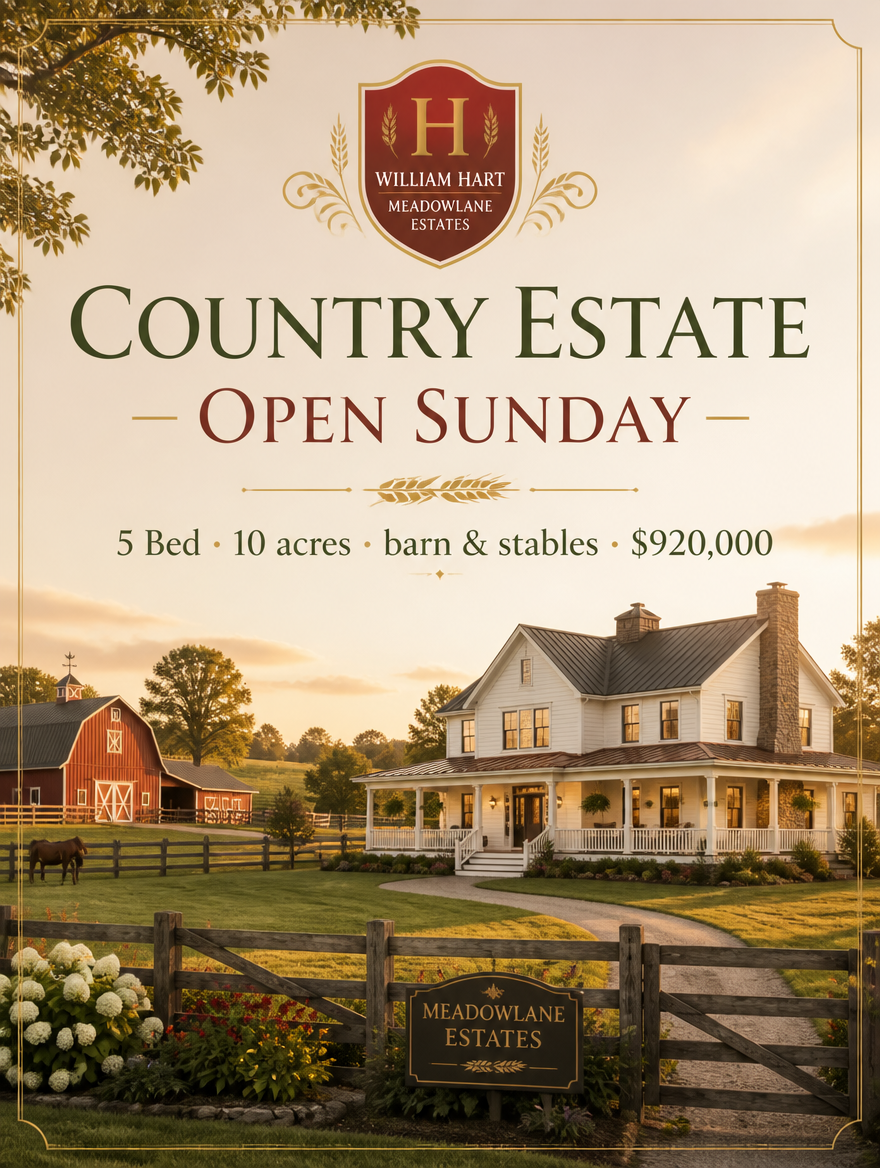
An elegant open-house flyer for a country farmhouse estate. A golden-hour render of a white farmhouse with a wraparound porch, a red barn, and rolling green pasture behind a wooden fence. Graceful serif reads 'COUNTRY ESTATE — OPEN SUNDAY.' A wheat-motif divider precedes '5 Bed · 10 acres · barn & stables · $920,000.' A crest badge names 'William Hart, Meadowlane Estates.' Palette of warm cream, barn red, meadow green, gold. Refined, pastoral, luxury-country lifestyle appeal.

Example generated from “Sushi Happy Hour”
GPT Image 2en

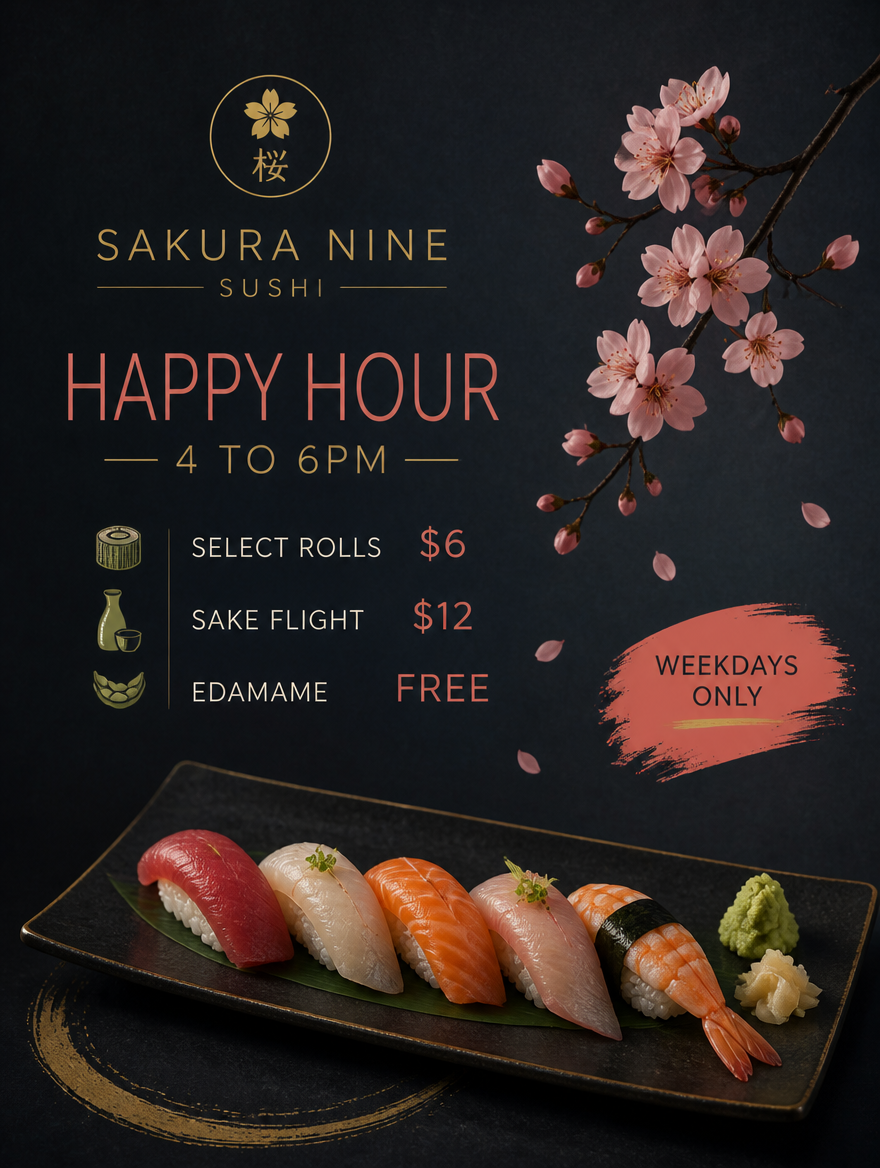
A sleek restaurant menu-special flyer for 'Sakura Nine Sushi.' A minimalist dark slate background with an elegant illustration of a nigiri set and a single pink cherry blossom branch. Refined thin sans reads 'HAPPY HOUR — 4 TO 6PM.' A clean list shows 'select rolls $6 · sake flight $12 · edamame free.' A brush-stroke badge notes 'weekdays only.' Palette of slate black, salmon pink, seaweed green, gold. Elegant, minimal, upscale-Japanese refinement.

Example generated from “Pizza Family Deal”
GPT Image 2en

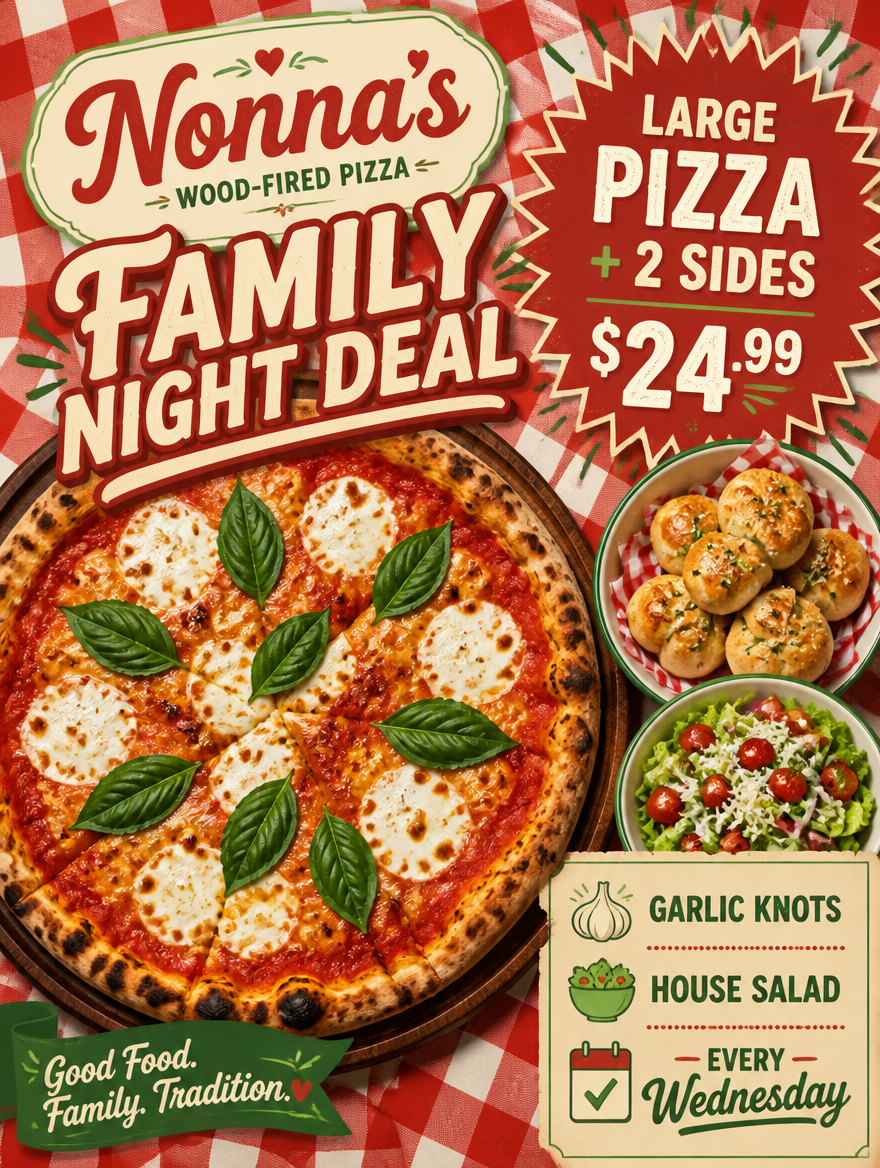
A fun restaurant menu-special flyer for 'Nonna's Wood-Fired Pizza.' A mouthwatering top-down illustration of a bubbling margherita pizza with fresh basil on a checkered red-and-white tablecloth. Chunky retro script reads 'FAMILY NIGHT DEAL.' A bright starburst shouts 'LARGE PIZZA + 2 SIDES — $24.99.' A small list notes 'garlic knots · house salad · every Wednesday.' Palette of tomato red, cream, basil green, mozzarella white. Warm, hearty, family-pizzeria comfort.

Example generated from “Brunch Menu Poster”
GPT Image 2en

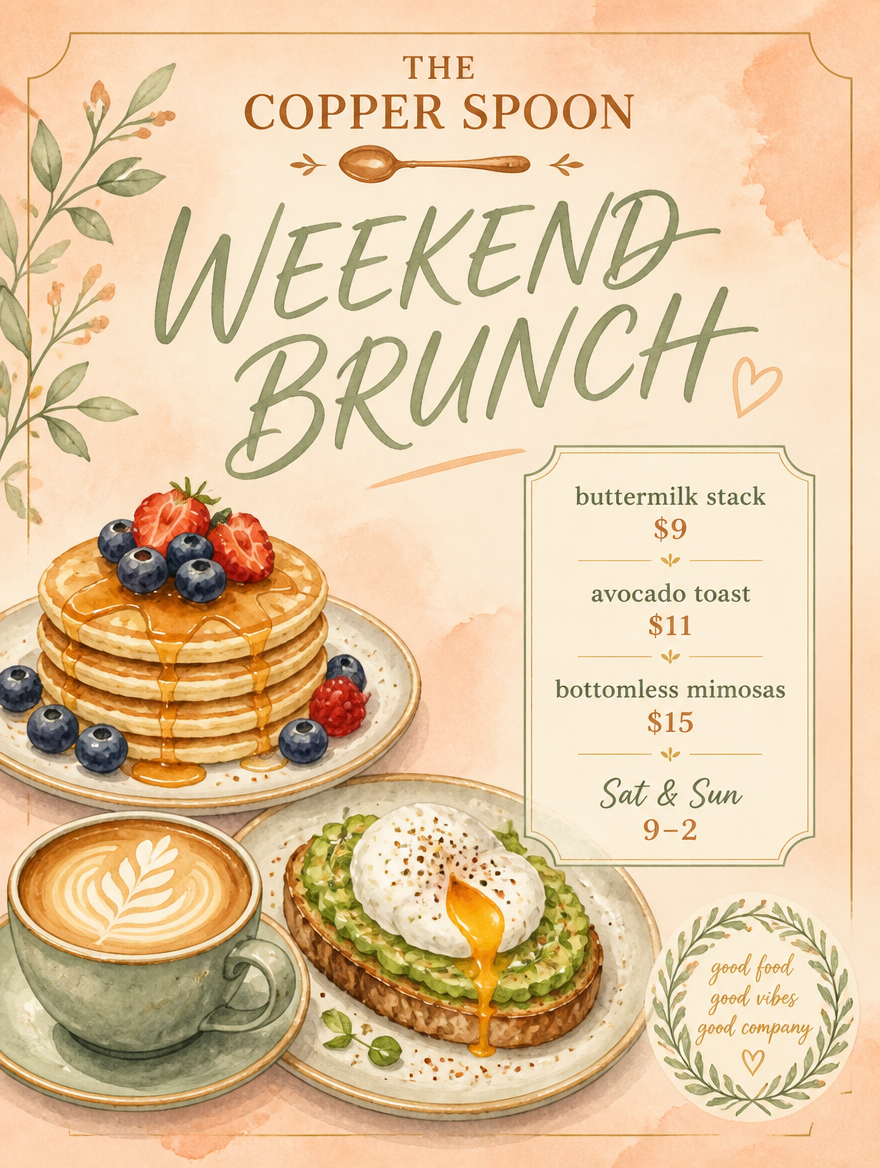
A charming restaurant brunch-special flyer for 'The Copper Spoon.' A soft watercolor illustration of pancakes with berries, a poached egg on toast, and a latte on a pastel peach background. Elegant handwritten script reads 'WEEKEND BRUNCH.' A tidy menu lists 'buttermilk stack $9 · avocado toast $11 · bottomless mimosas $15 · Sat & Sun 9–2.' A small sprig badge decorates the corner. Palette of peach, sage, cream, soft gold. Cozy, delightful, artisan-cafe brunch charm.

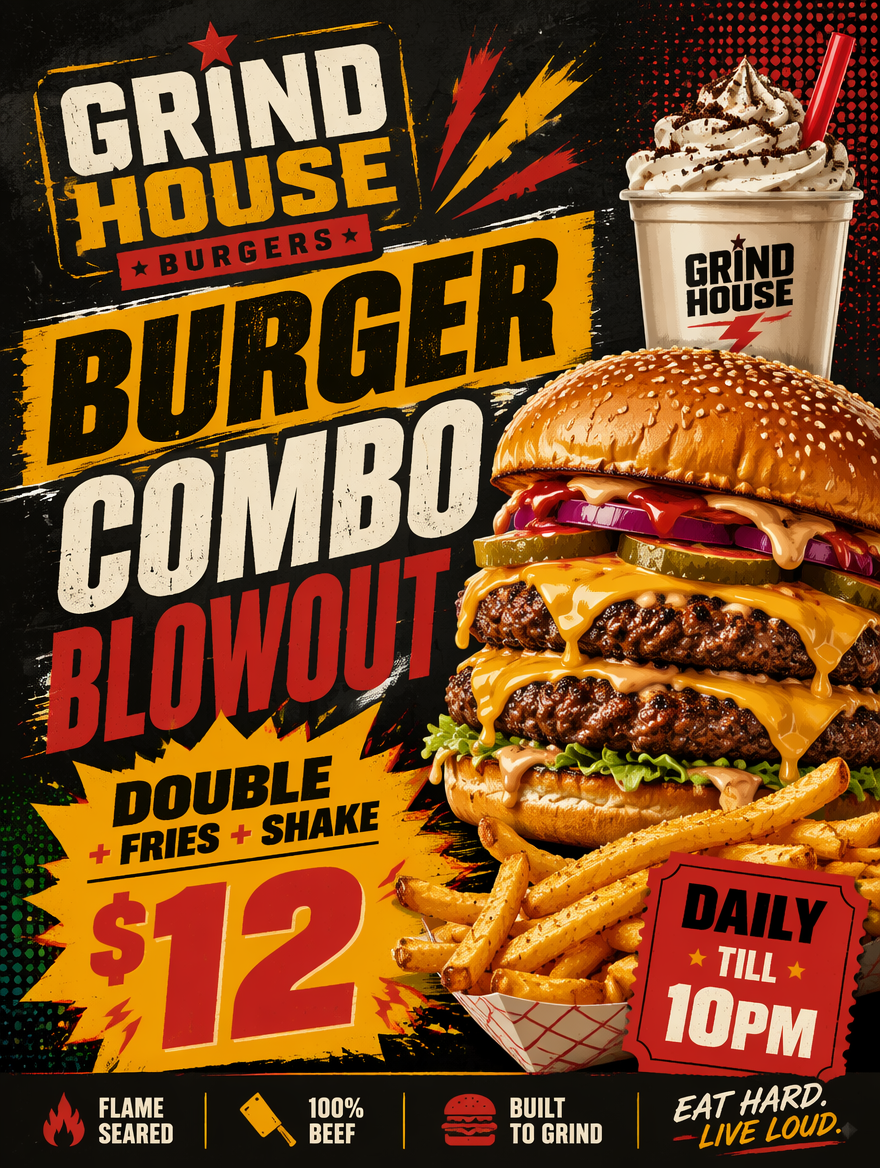
Example generated from “Burger Combo Blowout”
GPT Image 2en

A bold restaurant menu-special flyer for 'Grind House Burgers.' A juicy illustrated double cheeseburger with dripping cheese and crispy fries on a gritty dark background with halftone accents. Heavy impact type shouts 'BURGER COMBO BLOWOUT.' A price flash reads 'DOUBLE + FRIES + SHAKE — $12.' A ticket badge notes 'daily till 10pm.' Palette of charcoal, mustard yellow, ketchup red, cream. Loud, craveable, gritty street-food energy.

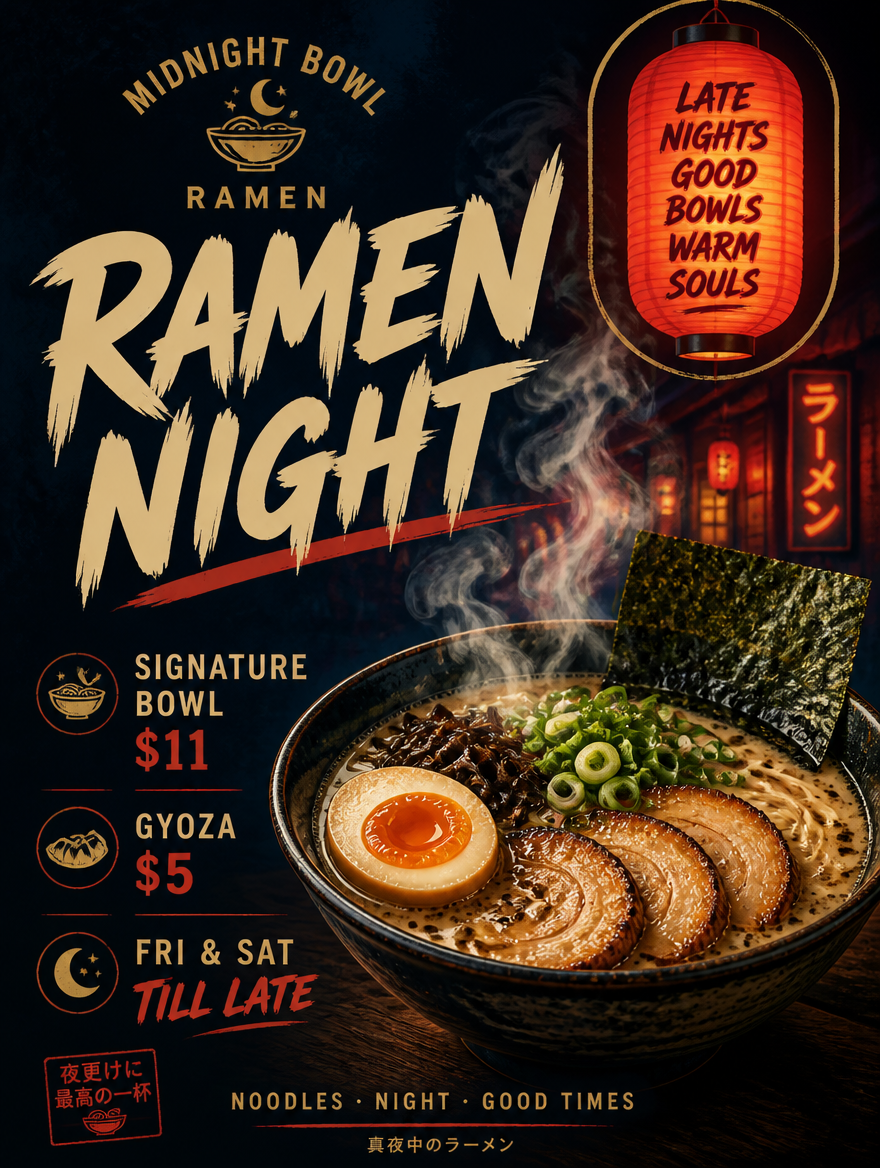
Example generated from “Ramen Night Special”
GPT Image 2en

An atmospheric restaurant menu-special flyer for 'Midnight Bowl Ramen.' A steamy illustration of a rich tonkotsu ramen bowl with soft egg, nori, and scallions, rising steam curling upward against a deep indigo background with red lantern glow. Bold brush-style caps read 'RAMEN NIGHT.' A list shows 'signature bowl $11 · gyoza $5 · Fri & Sat till late.' A lantern badge glows in the corner. Palette of indigo, lantern red, warm cream, gold. Moody, comforting, late-night noodle-bar vibe.

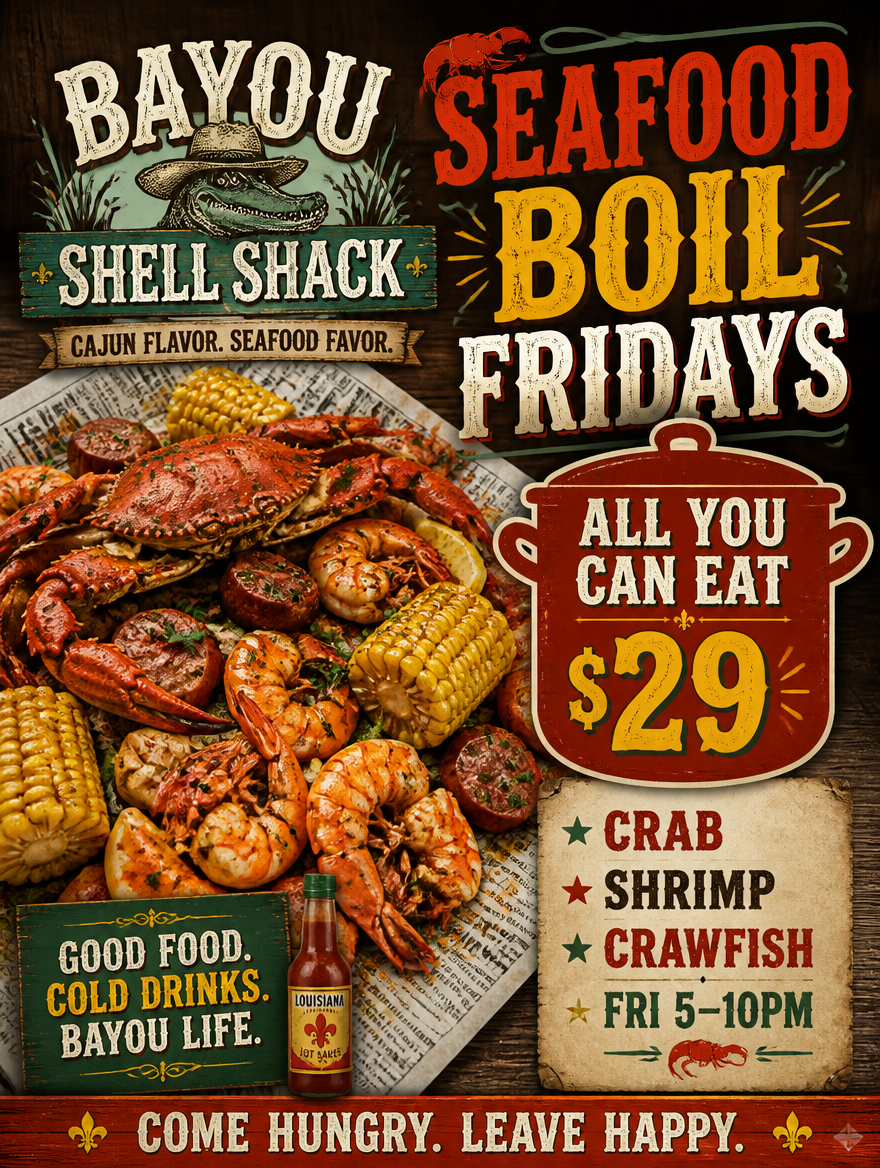
Example generated from “Seafood Boil Feast”
GPT Image 2en

A festive restaurant menu-special flyer for 'Bayou Shell Shack.' A vibrant illustration of a Cajun seafood boil — crab, shrimp, corn, and sausage spilled on newspaper — on a rustic wood background. Bold cajun-style display type reads 'SEAFOOD BOIL FRIDAYS.' A pot-shaped badge shouts 'ALL YOU CAN EAT — $29.' A list notes 'crab · shrimp · crawfish · Fri 5–10pm.' Palette of boil red, corn yellow, rustic brown, sea green. Hearty, festive, southern-comfort feast energy.

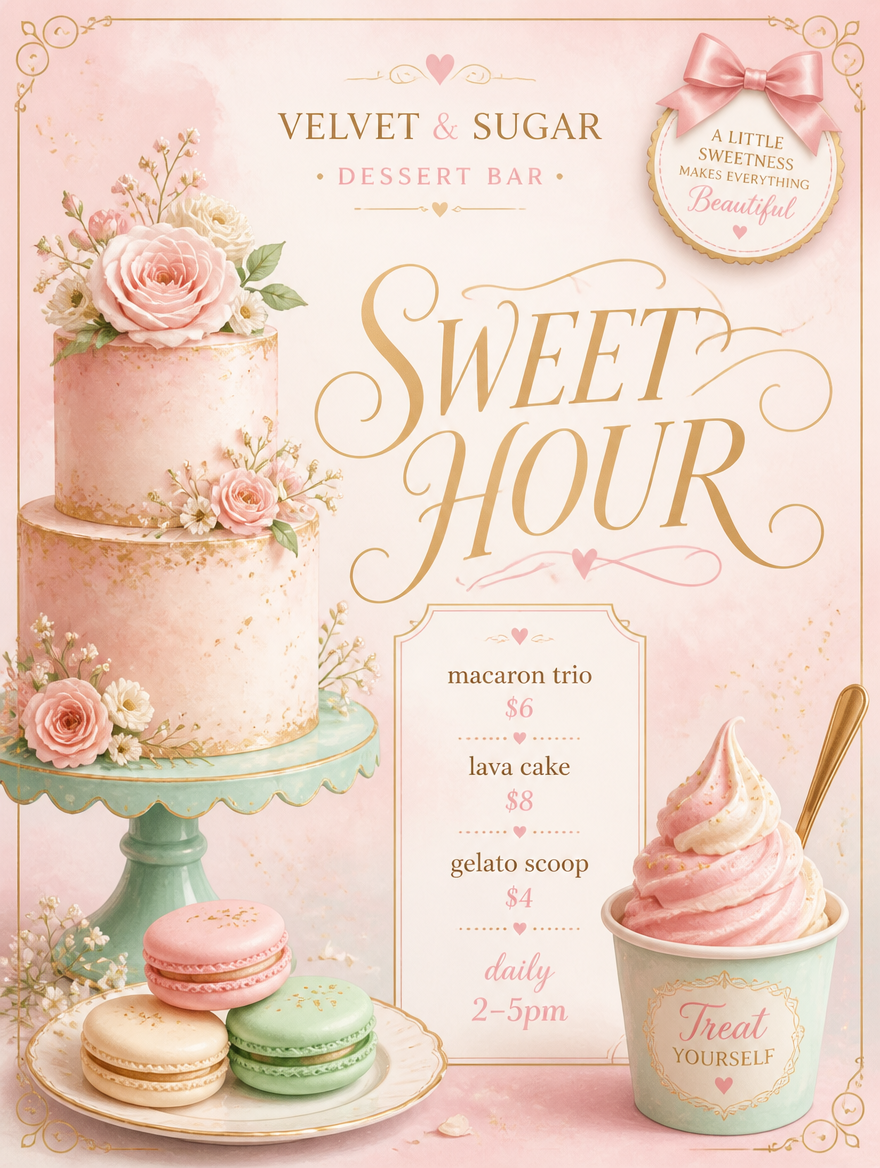
Example generated from “Dessert Bar Specials”
GPT Image 2en

A sweet restaurant menu-special flyer for 'Velvet & Sugar Dessert Bar.' A delicate illustration of a tiered cake, macarons, and a swirl of gelato on a soft pastel-pink background with gold flecks. Elegant flowing script reads 'SWEET HOUR.' A dainty list shows 'macaron trio $6 · lava cake $8 · gelato scoop $4 · daily 2–5pm.' A tiny bow badge decorates the corner. Palette of pastel pink, mint, cream, champagne gold. Dainty, indulgent, boutique-patisserie sweetness.

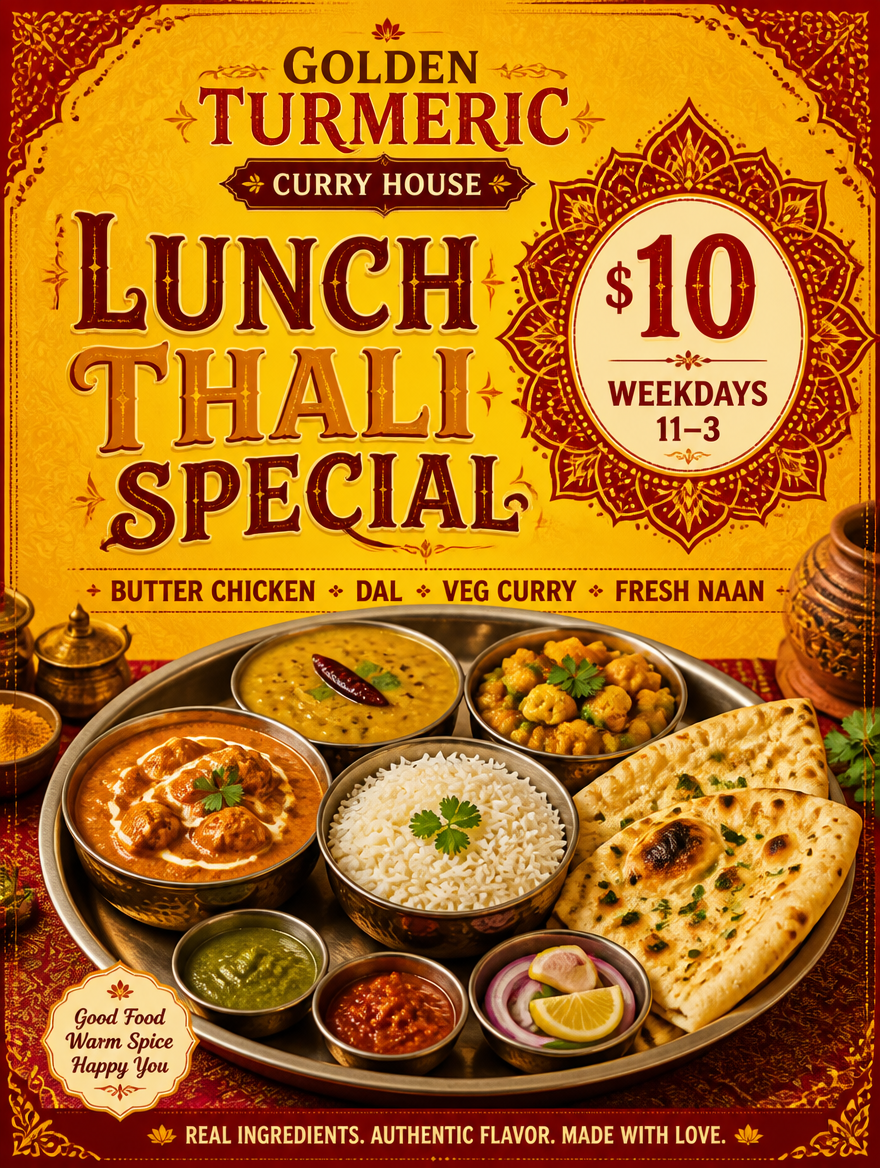
Example generated from “Curry House Lunch”
GPT Image 2en

A warm restaurant lunch-special flyer for 'Golden Turmeric Curry House.' A rich illustration of a thali platter — curry, rice, naan, and chutneys — with warm spice-toned patterns bordering a deep saffron background. Ornate display type reads 'LUNCH THALI SPECIAL.' A mandala badge shows '$10 — WEEKDAYS 11–3.' A list notes 'butter chicken · dal · veg curry · fresh naan.' Palette of saffron, deep red, turmeric gold, cream. Warm, aromatic, richly-spiced South-Asian appeal.

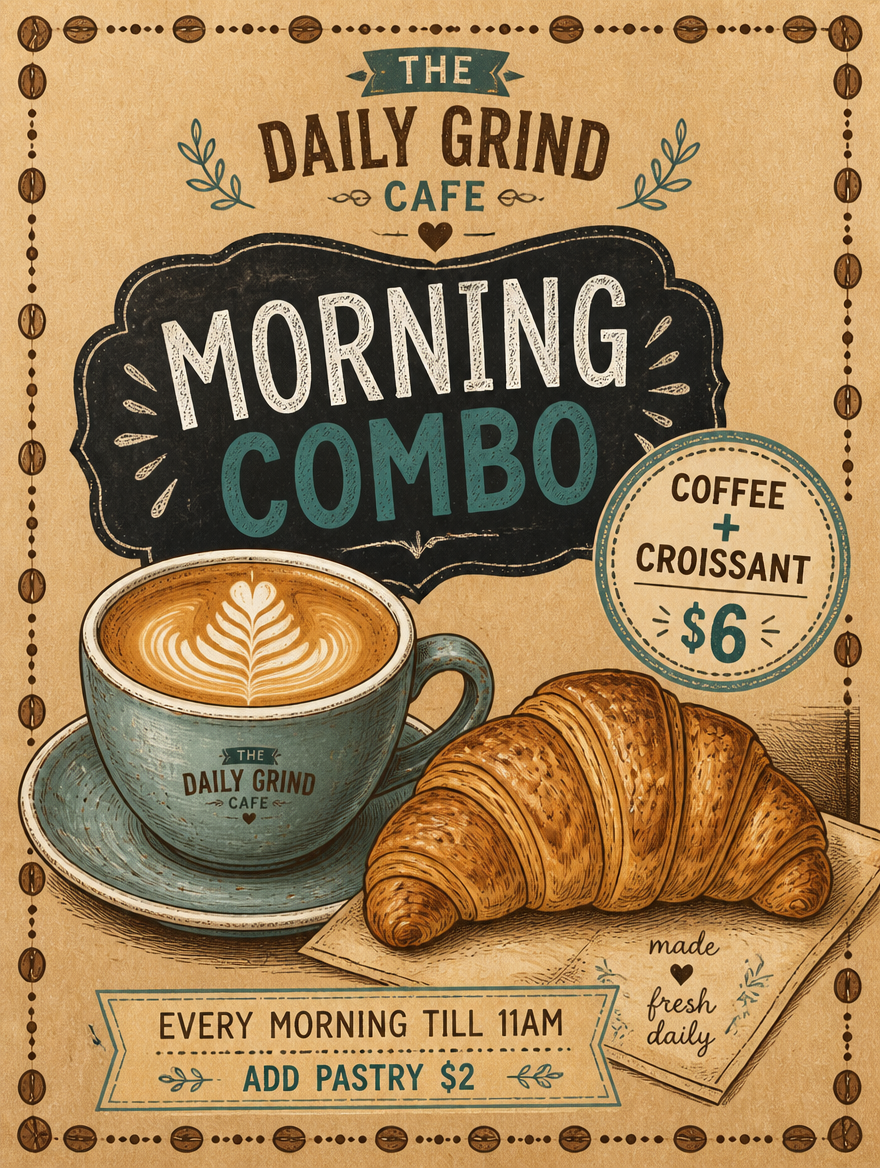
Example generated from “Coffee & Pastry Combo”
GPT Image 2en

A cozy cafe menu-special flyer for 'The Daily Grind Cafe.' A warm hand-drawn illustration of a flat white with latte art and a flaky croissant on a rustic kraft-paper background. Friendly chalkboard lettering reads 'MORNING COMBO.' A stamp badge shows 'COFFEE + CROISSANT — $6.' A tidy note lists 'every morning till 11am · add pastry $2.' A small coffee-bean border frames the edge. Palette of kraft brown, cream, muted teal, espresso. Cozy, wholesome, neighborhood-cafe warmth.

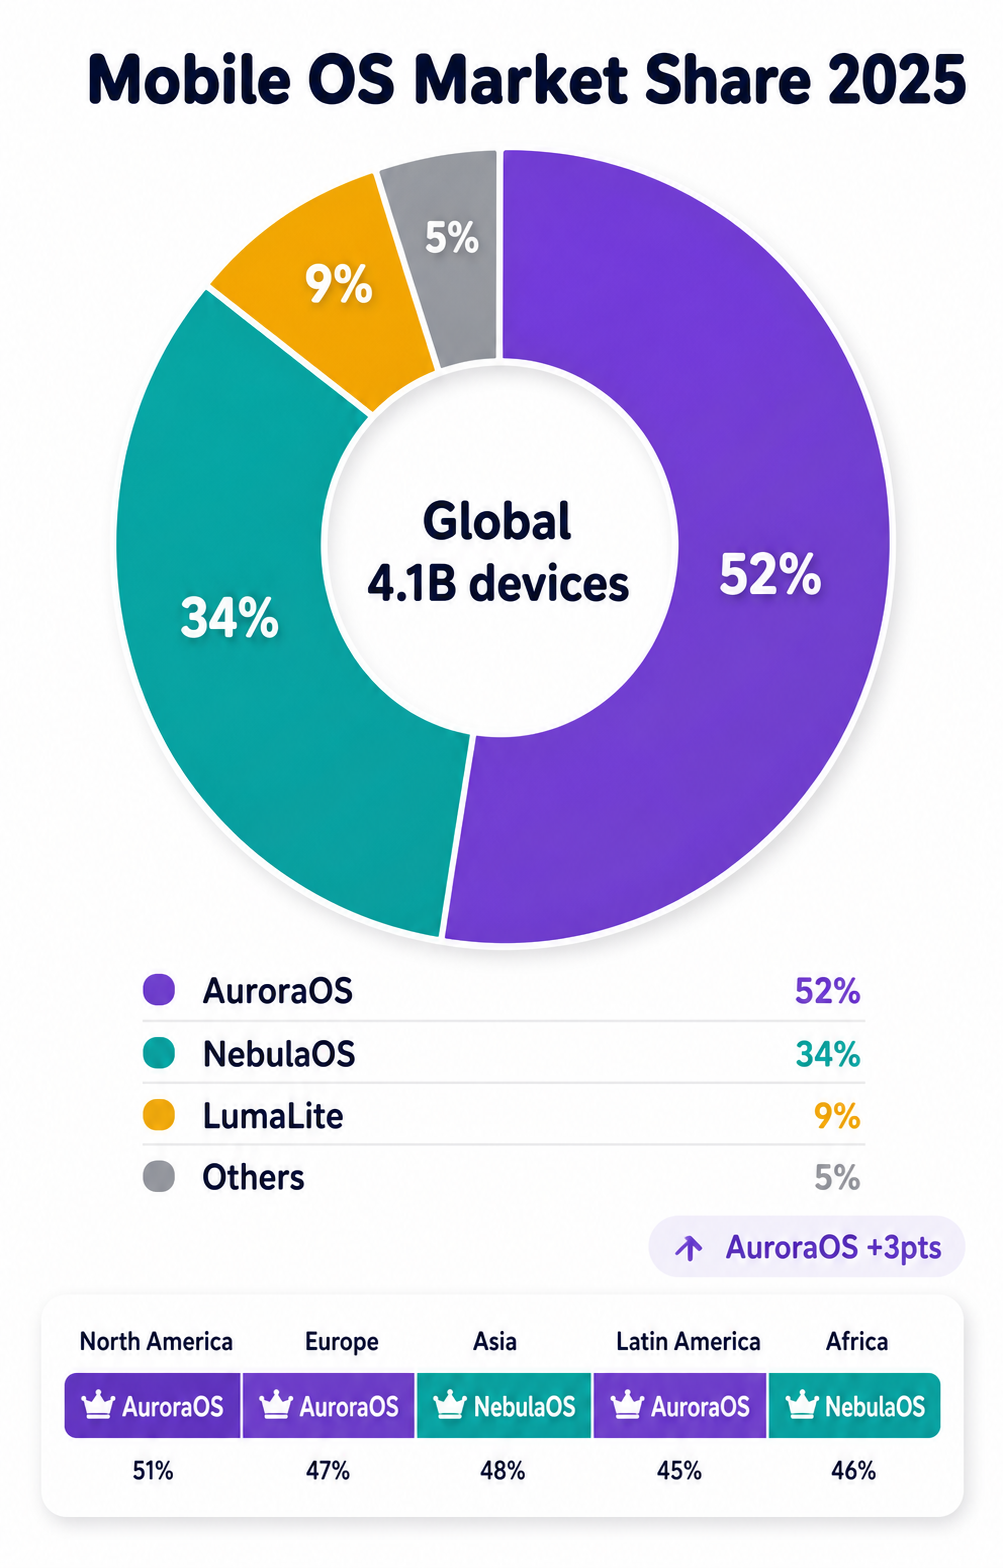
Example generated from “Mobile OS Market Share”
GPT Image 2en

A market-share infographic, 4:5, titled 'Mobile OS Market Share 2025'. A large donut chart splits the market between invented systems: AuroraOS 52% (purple), NebulaOS 34% (teal), LumaLite 9% (amber), Others 5% (grey). The donut center reads 'Global 4.1B devices'. A legend with color dots and exact percentages sits below, plus a small year-over-year change note ('AuroraOS +3pts'). A tiny regional split bar shows differing leaders by continent. Clean white background, flat design, bold rounded headline, subtle shadows, modern data-report aesthetic.

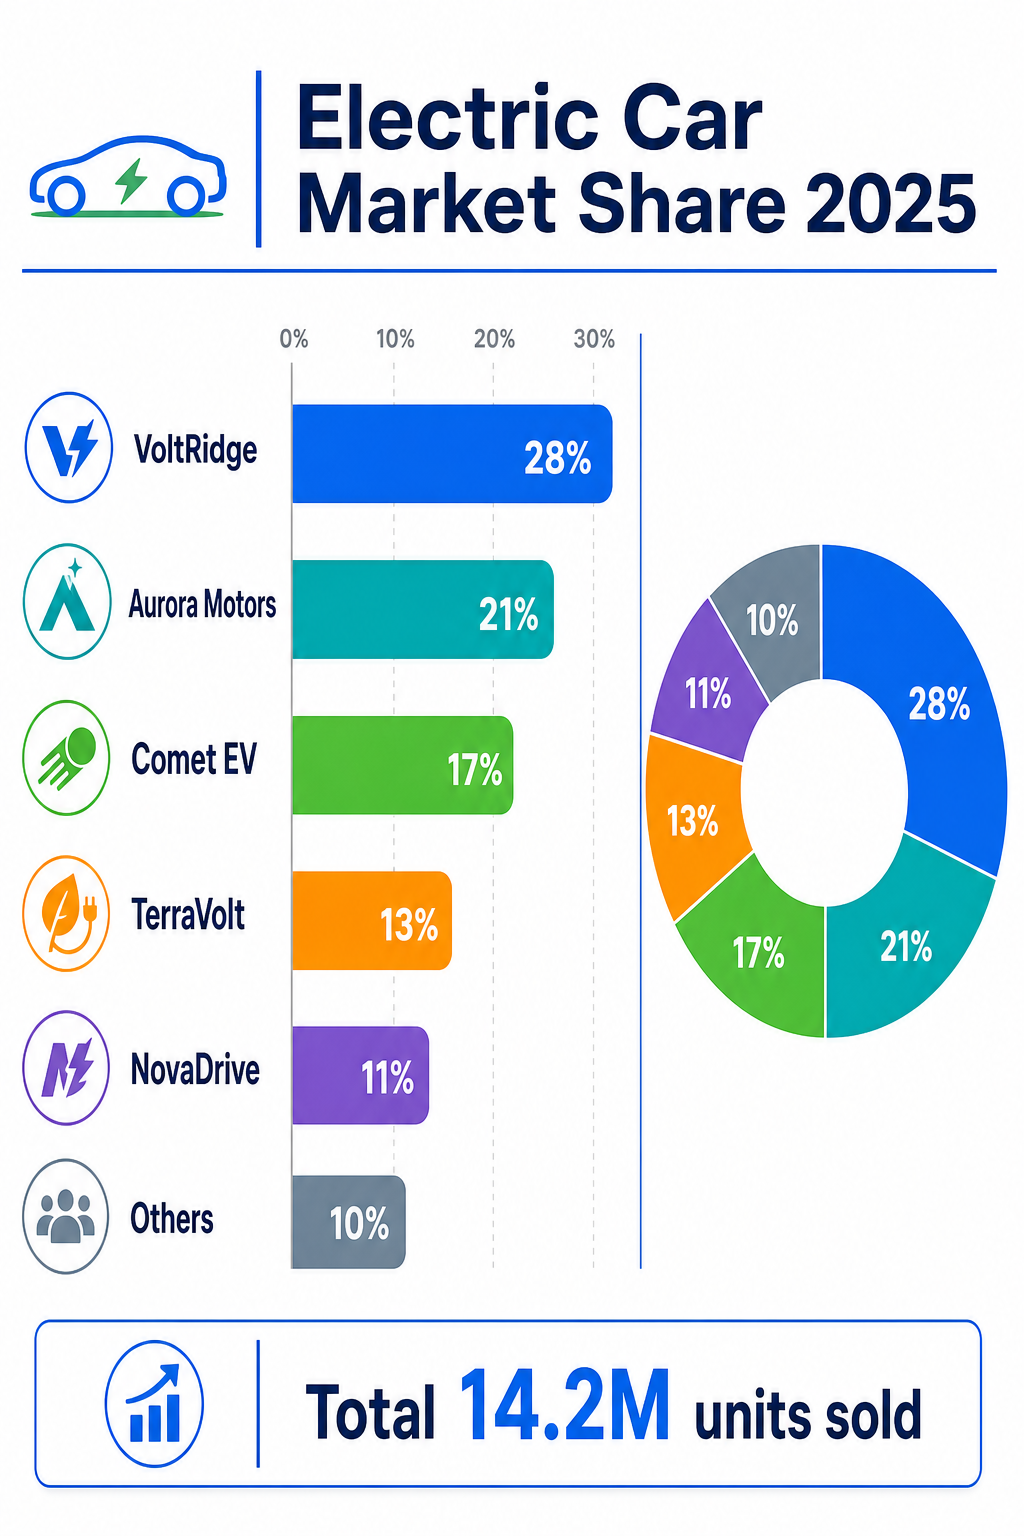
Example generated from “EV Brand Market Share”
GPT Image 2en

A market-share infographic, 2:3, titled 'Electric Car Market Share 2025'. A horizontal bar chart ranks invented EV makers: VoltRidge 28%, Aurora Motors 21%, Comet EV 17%, TerraVolt 13%, NovaDrive 11%, Others 10%, each bar in a distinct color with the percentage in bold. Small car-badge icons head each row. A side donut echoes the split, and a footer stat reads 'Total 14.2M units sold'. Clean flat design, electric-blue and green palette, white background, rounded bars, thin grid, modern automotive data-report aesthetic, crisp sans-serif.

Example generated from “Cloud Provider Market Share”
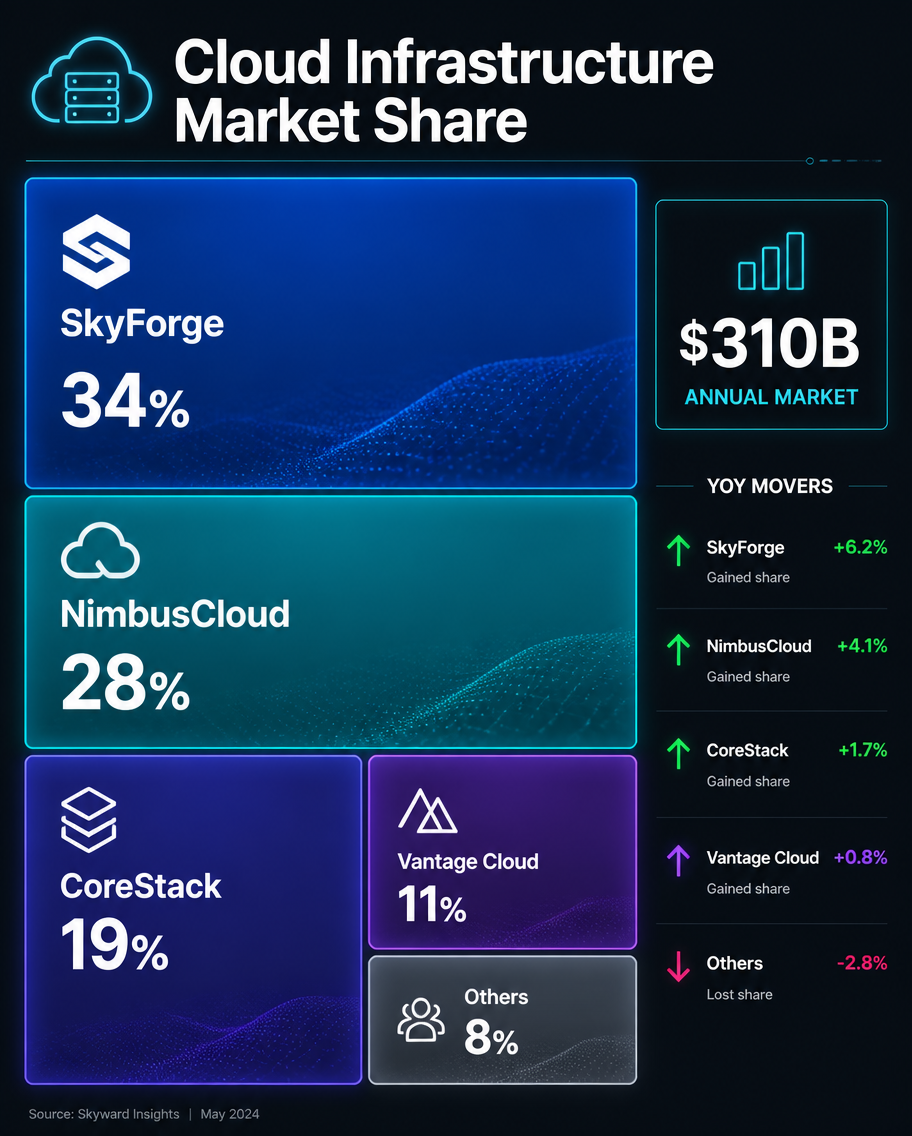
GPT Image 2en

A tech market-share infographic, 4:5, titled 'Cloud Infrastructure Market Share'. A treemap-style block layout sizes invented providers by share: SkyForge 34% (large blue block), NimbusCloud 28% (teal), CoreStack 19% (indigo), Vantage Cloud 11% (purple), Others 8% (grey). Each block shows the name and percentage in white. A small side note '$310B annual market' and a mini arrow list of YoY movers. Dark charcoal background, neon-accent blocks with glowing edges, clean white type, sleek modern tech data-report aesthetic.

Example generated from “Streaming Platform Share”
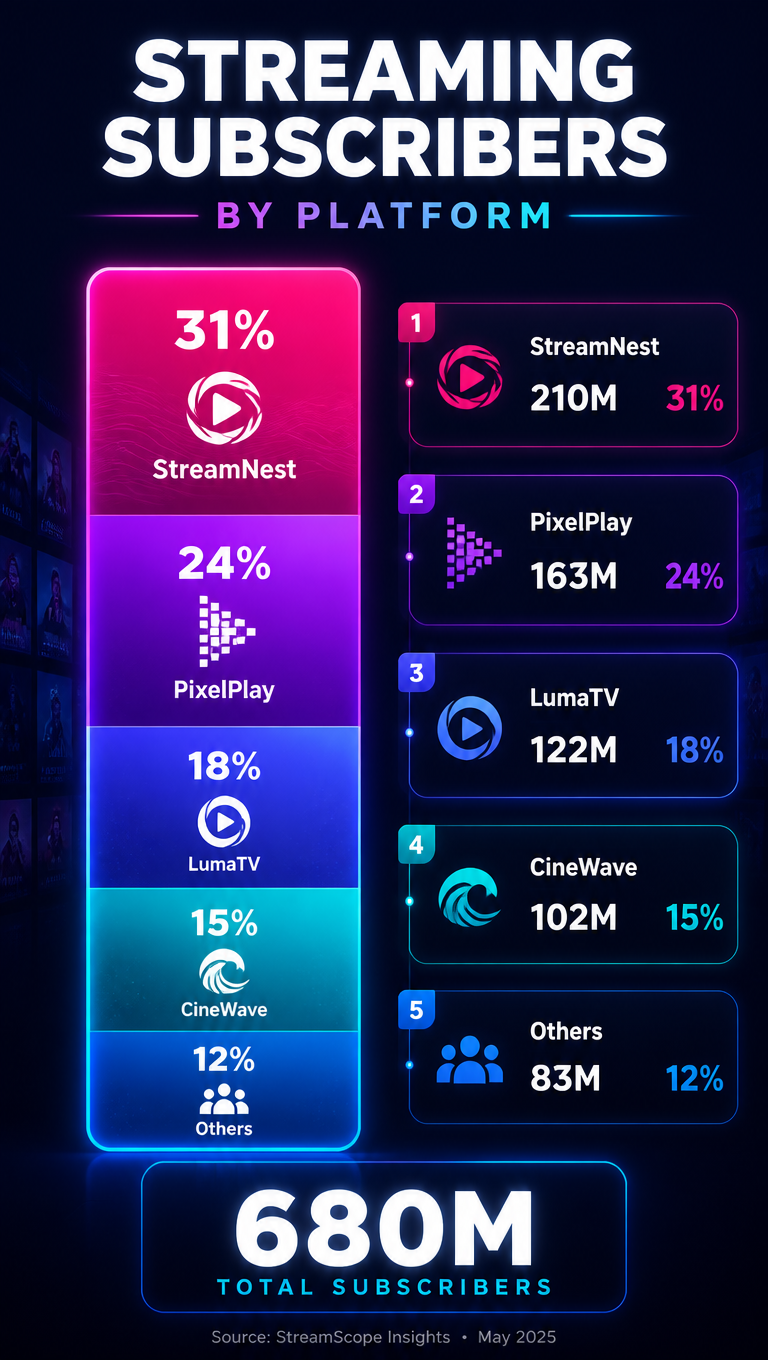
GPT Image 2en

A media market-share infographic, 9:16, titled 'Streaming Subscribers by Platform'. A vertical stacked-column layout where one tall bar splits into invented services: StreamNest 31%, PixelPlay 24%, LumaTV 18%, CineWave 15%, Others 12%, each segment labeled with a percentage and a tiny logo shape. Beside it, a ranked mini-card list repeats the numbers with subscriber counts (e.g., StreamNest 210M). A footer '680M total subscribers'. Deep midnight-blue background, magenta-cyan gradient segments, glowing edges, sleek streaming-brand data aesthetic, bold white type.

Example generated from “Coffee Chain Market Share”
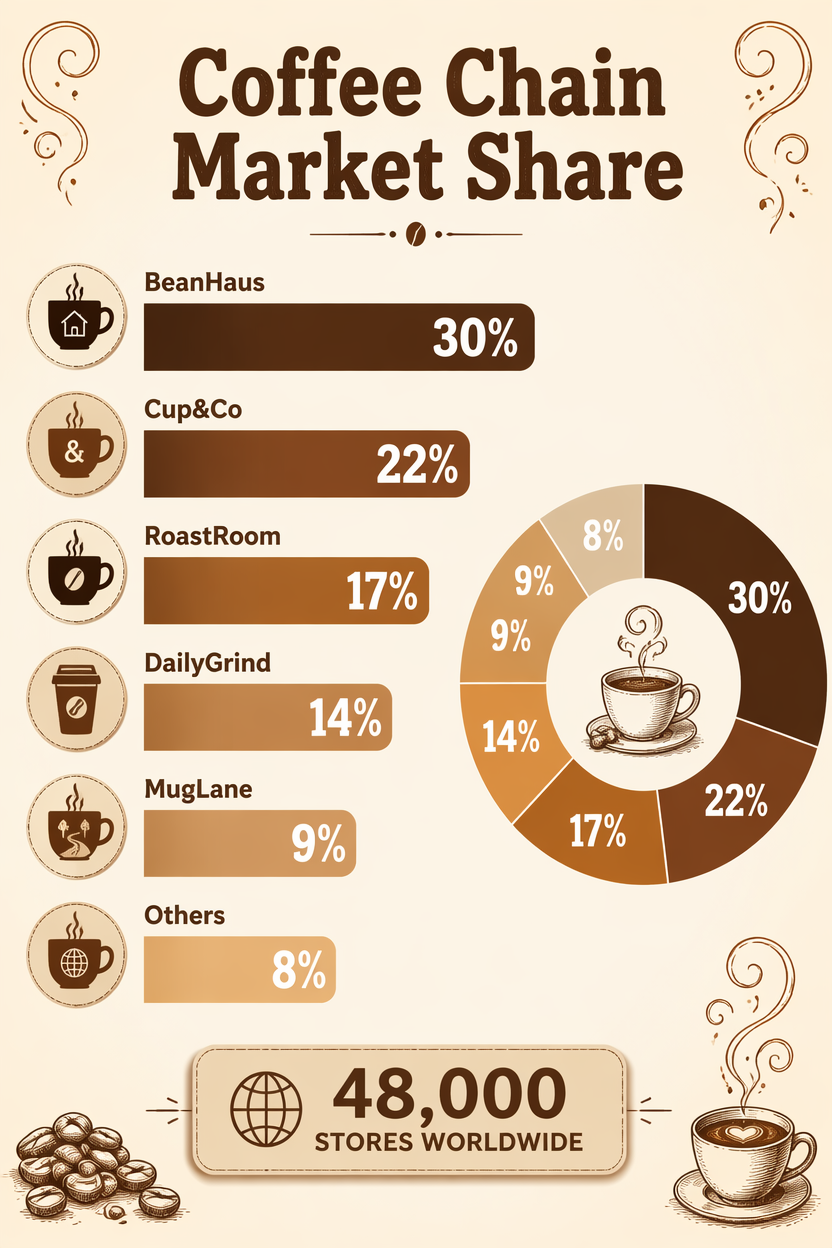
GPT Image 2en

A retail market-share infographic, 2:3, titled 'Coffee Chain Market Share'. A horizontal bar ranking of invented chains: BeanHaus 30%, Cup&Co 22%, RoastRoom 17%, DailyGrind 14%, MugLane 9%, Others 8%, each bar in a warm brown-to-caramel gradient with bold percentages. Small coffee-cup badge icons head each row. A side donut mirrors the shares and a footer reads '48,000 stores worldwide'. Warm cream background, coffee-brown headline, hand-drawn steam swirls in corners, rounded bars, cozy modern retail-data aesthetic, clean type.

Example generated from “Gaming Console Share”
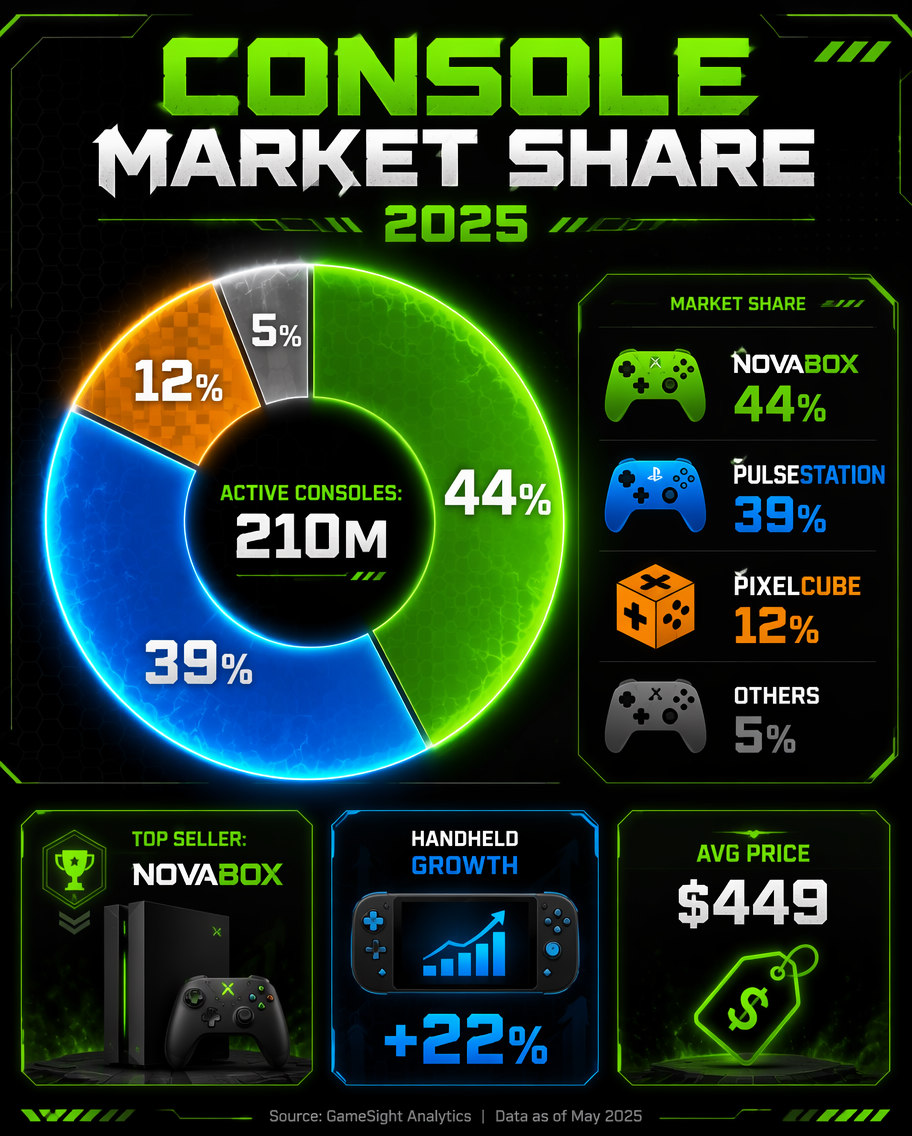
GPT Image 2en

A gaming market-share infographic, 4:5, titled 'Console Market Share 2025'. A donut chart splits invented consoles: NovaBox 44% (green), PulseStation 39% (blue), PixelCube 12% (orange), Others 5% (grey). Center label 'Active consoles: 210M'. A legend with controller-shaped color chips and percentages, plus three mini stat tiles: 'Top seller: NovaBox', 'Handheld growth +22%', 'Avg price $449'. Dark gamer palette of black, neon-green, and electric-blue, glowing donut edges, angular futuristic accents, bold arcade-style headline, sleek gaming data aesthetic.

Example generated from “Ride-Hailing Market Share”
GPT Image 2en

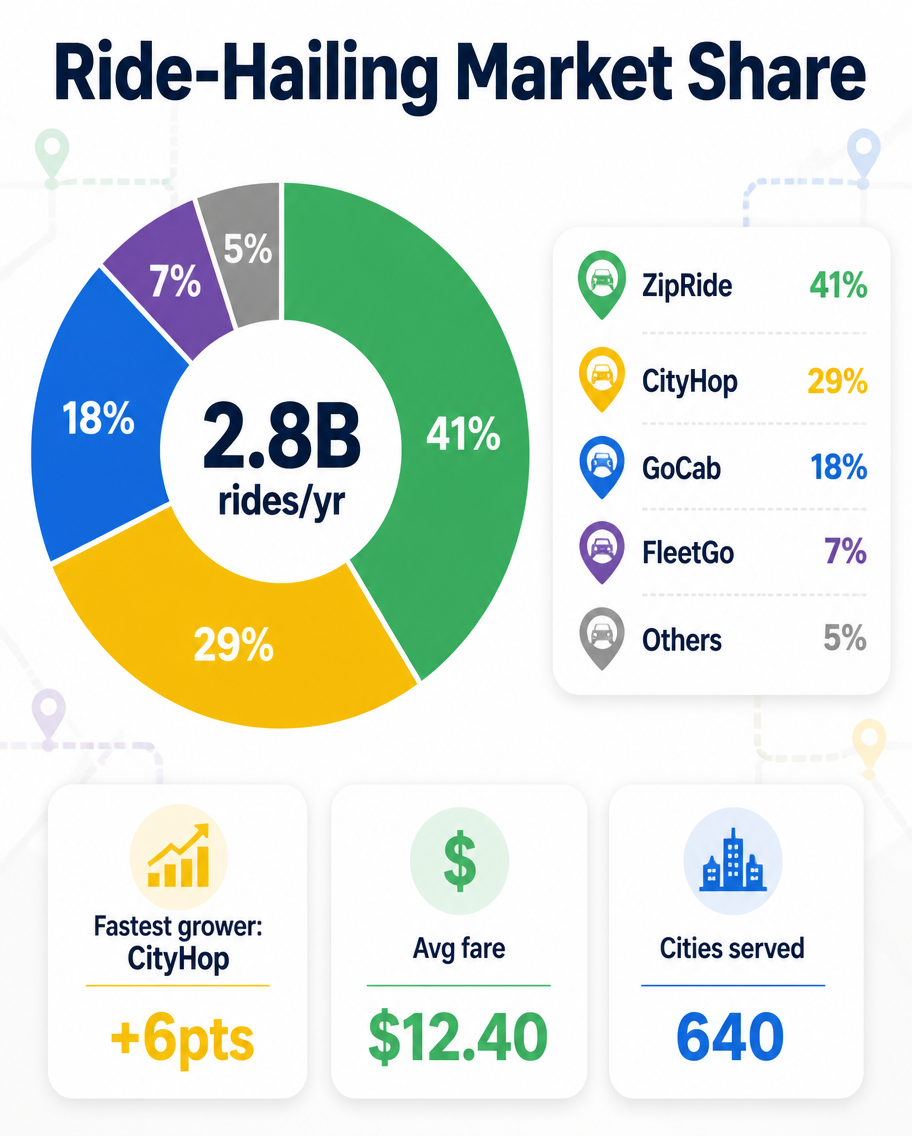
A mobility market-share infographic, 4:5, titled 'Ride-Hailing Market Share'. A donut chart divides invented apps: ZipRide 41% (green), CityHop 29% (yellow), GoCab 18% (blue), FleetGo 7% (purple), Others 5% (grey). Center reads '2.8B rides/yr'. A legend with car-pin color chips and percentages, plus three mini tiles: 'Fastest grower: CityHop +6pts', 'Avg fare $12.40', 'Cities served 640'. Clean white background, flat design, map-route line motifs faintly in the background, rounded widgets, modern mobility data-report aesthetic, bold headline.

Example generated from “Social Platform Market Share”
GPT Image 2en

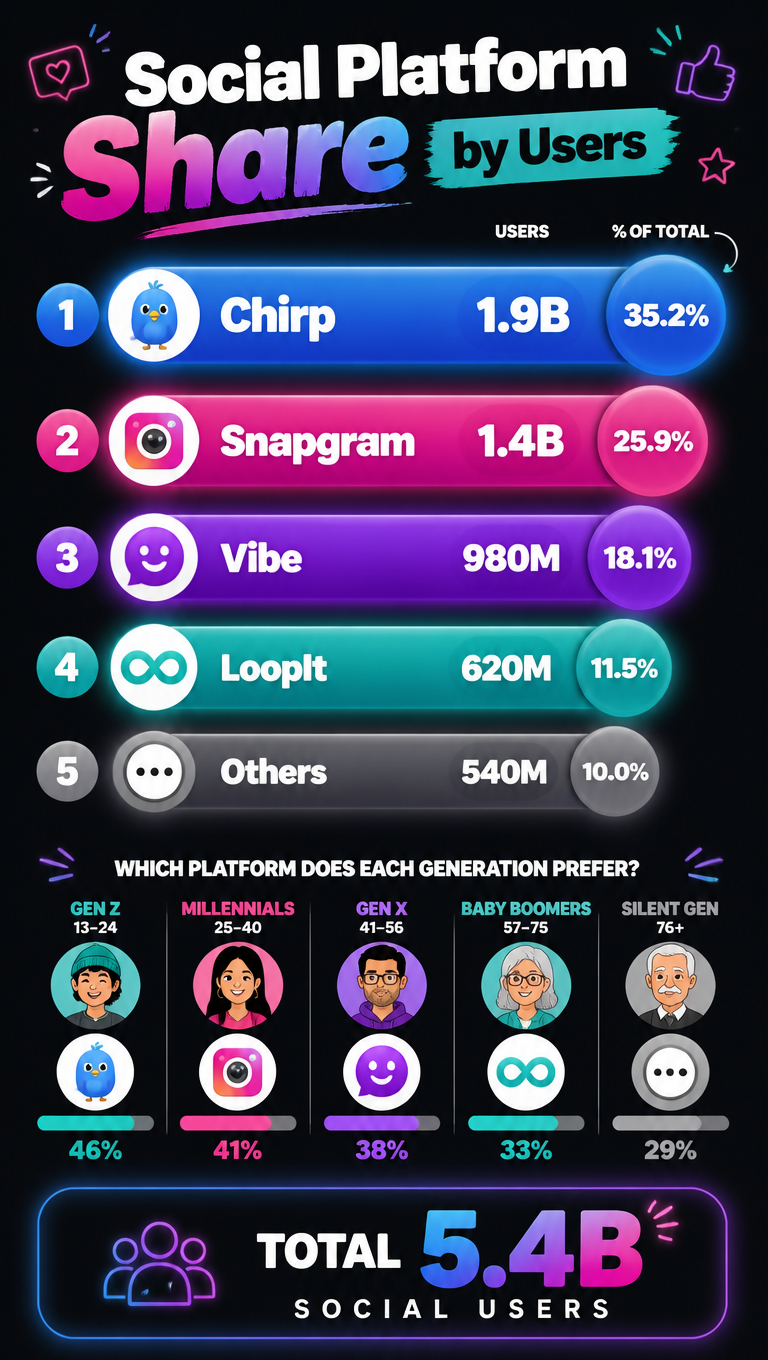
A social-media market-share infographic, 9:16, titled 'Social Platform Share by Users'. A vertical ranked layout: horizontal bubble bars for invented platforms sized by users: Chirp 1.9B (blue), Snapgram 1.4B (magenta), Vibe 980M (purple), LoopIt 620M (teal), Others 540M (grey), each with a percentage of total. A small age-split mini bar shows which platform each generation prefers. A footer 'Total 5.4B social users'. Bright gradient palette on a dark background, glowing rounded bubbles, playful bold headline, trendy modern social-data aesthetic, clean white type.

Example generated from “The Water Cycle”
GPT Image 2en

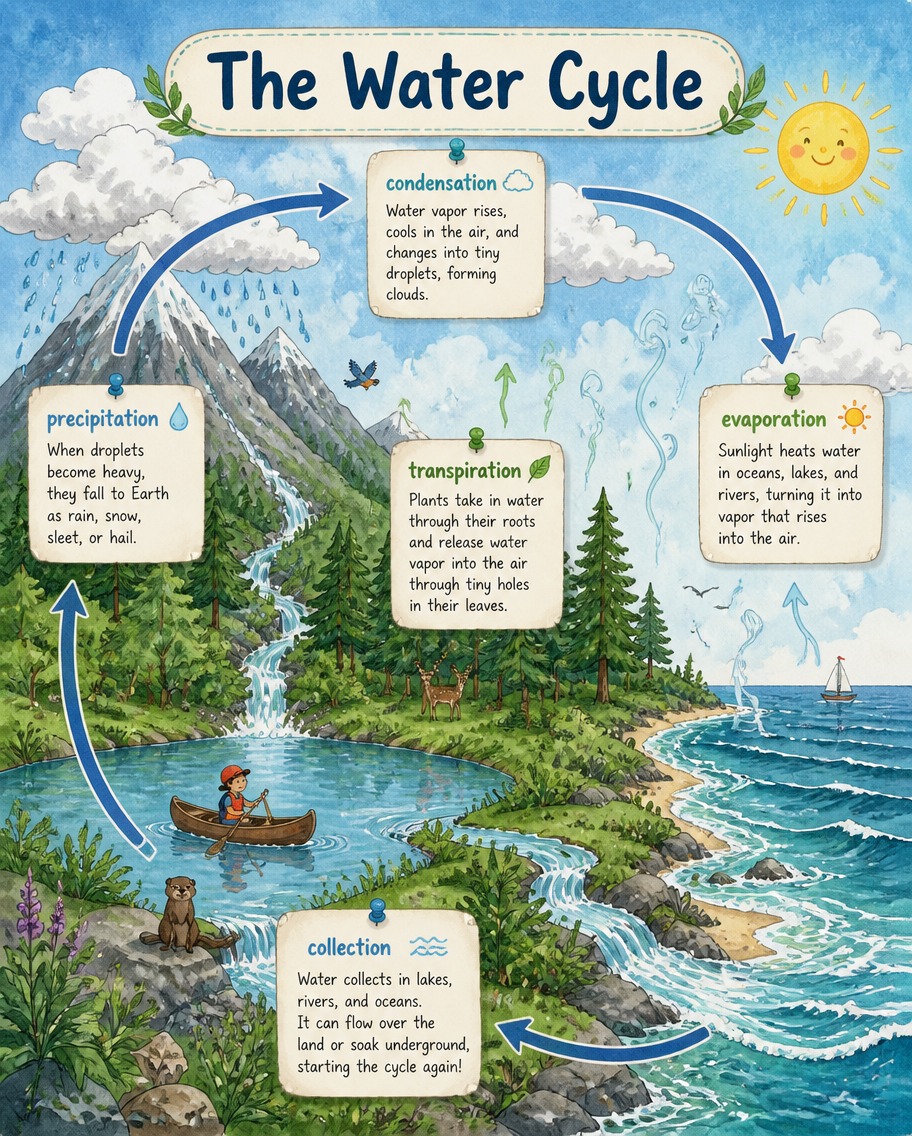
An earth-science infographic of the water cycle drawn as one continuous landscape scene. A mountain, forest, lake and ocean sit under a cloud-filled sky, connected by looping arrows labeled 'evaporation', 'condensation', 'precipitation', 'collection' and 'transpiration'. Tiny sun, raindrops and vapor swirls act as icons. Hand-illustrated storybook style with textured watercolor washes in teal, sky blue and moss green. Rounded title banner 'The Water Cycle' across the top, short caption paragraphs pinned beside each stage. Playful, kid-friendly composition.

Example generated from “Butterfly Metamorphosis”
GPT Image 2en

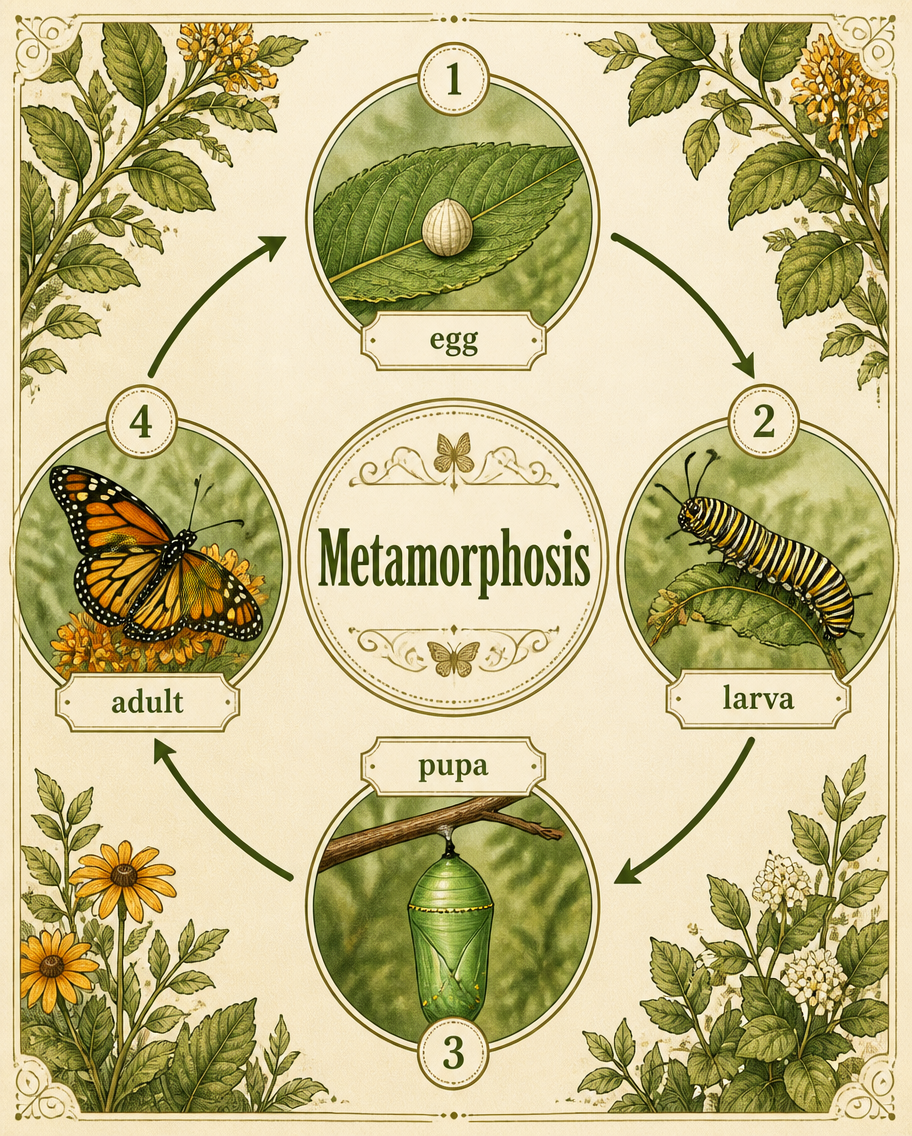
A life-cycle infographic showing the four stages of a monarch-style butterfly's metamorphosis arranged in a clockwise circle. An egg on a leaf, a striped caterpillar, a green chrysalis, and an emerged orange-and-black butterfly each sit in a circular vignette linked by curved directional arrows. Numbered 1-4 with stage names 'egg', 'larva', 'pupa', 'adult'. Detailed naturalistic illustration with fine linework, warm meadow-green and marigold palette on ivory. Central title medallion 'Metamorphosis'. Decorative leaves fill the corners.

Example generated from “Anatomy of a Volcano”
GPT Image 2en

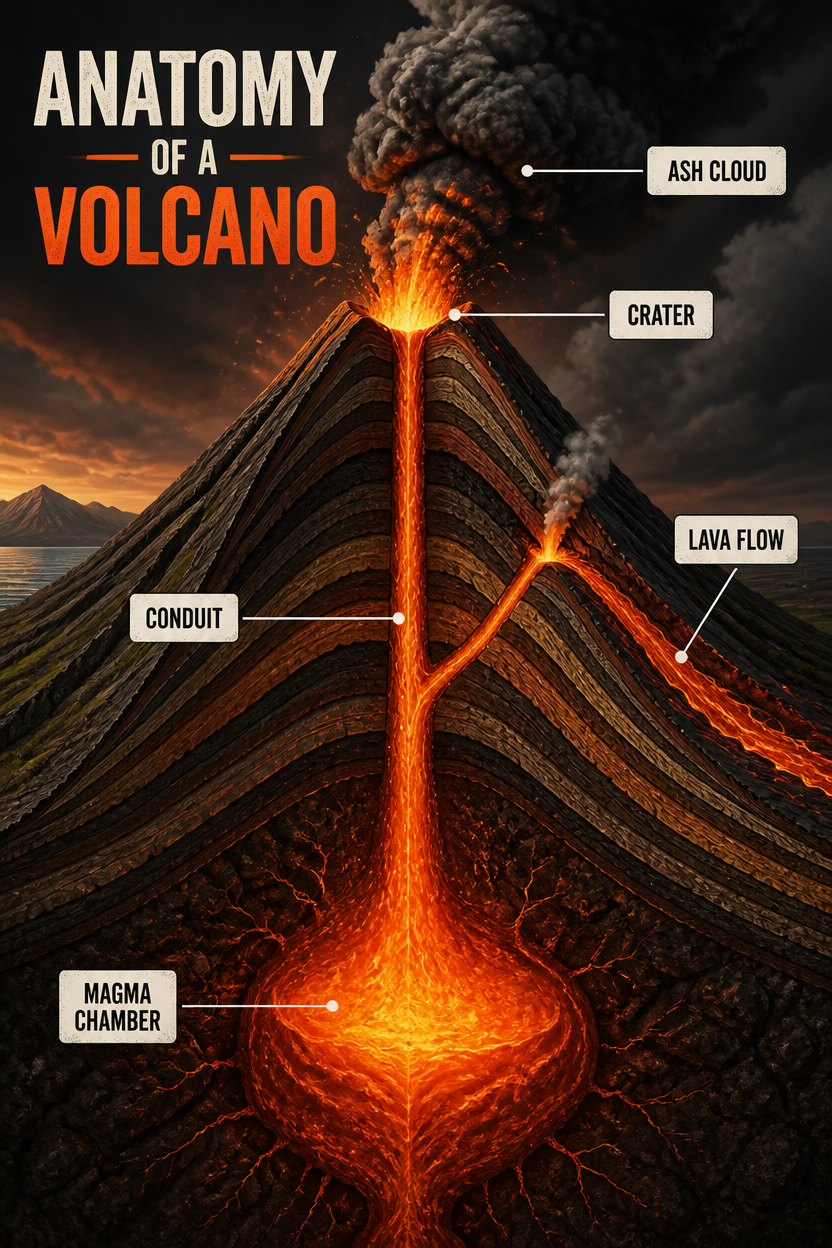
A geology cutaway infographic of a stratovolcano sliced in half. The cross-section reveals the magma chamber, central conduit, side vent, layered lava and ash strata, and an erupting summit with a smoke plume and lava bombs. A red-orange gradient marks molten rock; layered browns show cooled deposits. Thin white leader lines connect to label boxes: 'magma chamber', 'conduit', 'crater', 'ash cloud', 'lava flow'. Semi-realistic textured illustration under a dramatic dark sky. Bold title 'Anatomy of a Volcano' upper-left. Warm ember palette.

Example generated from “How a Bill Becomes Law”
GPT Image 2en

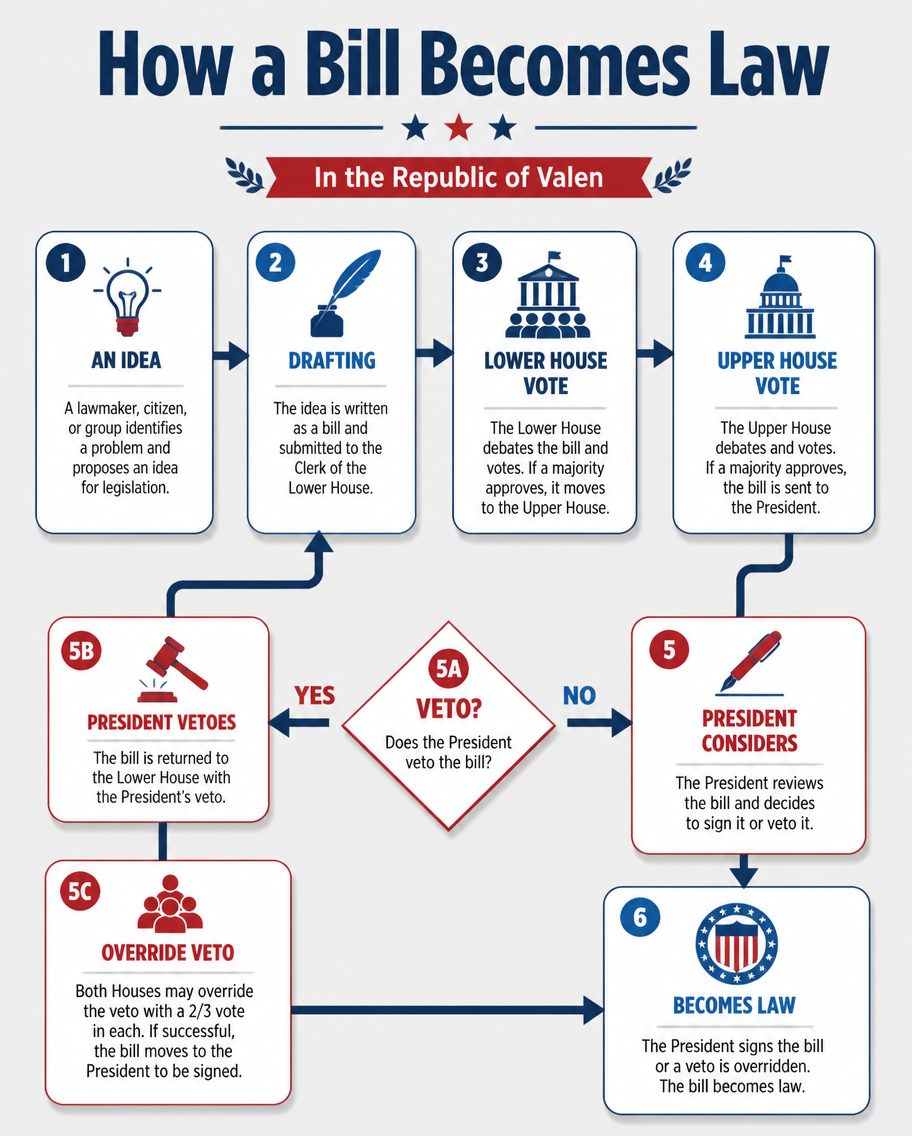
A civics flow-diagram infographic explaining how a bill becomes law in the fictional Republic of Valen. Boxes connected by arrows trace 'idea', 'drafting', 'lower house vote', 'upper house vote', 'president signs', 'becomes law', with a branching 'veto' loop back. Numbered steps and small icons (quill, ballot, gavel, seal). Clean flat vector style, a civic red-white-and-blue palette on light grey, rounded rectangular nodes with subtle shadows. Strong sans-serif title 'How a Bill Becomes Law' at the top, a decision diamond for the veto branch.

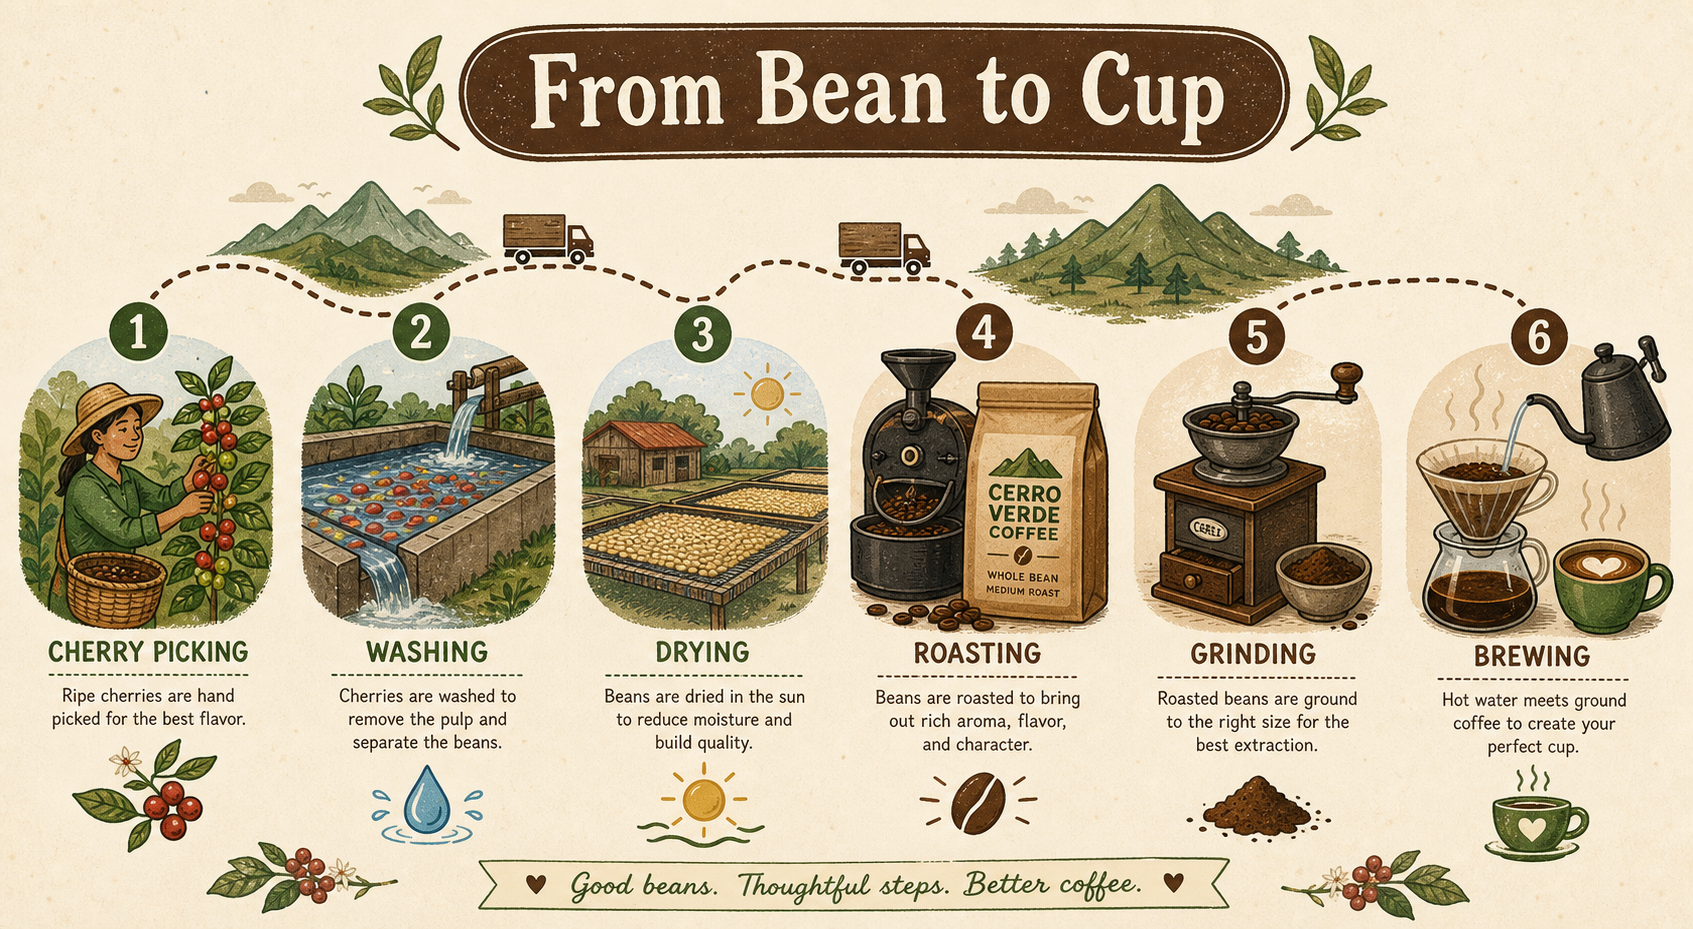
Example generated from “From Bean to Cup”
GPT Image 2en

A supply-chain flow infographic tracing coffee from farm to cup. A left-to-right path with illustrated stops - cherry picking, washing, drying, roasting, grinding, brewing - each numbered with a short caption and an icon. An invented brand 'Cerro Verde Coffee' appears on a roasting bag. Warm earthy palette of coffee-brown, leaf-green and cream, hand-drawn flat illustration with grain texture. A curved dotted route connects the stages, with small mountain and truck icons for transport. Rounded title banner 'From Bean to Cup' at the top.
Example generated from “The Software Development Lifecycle”
GPT Image 2en

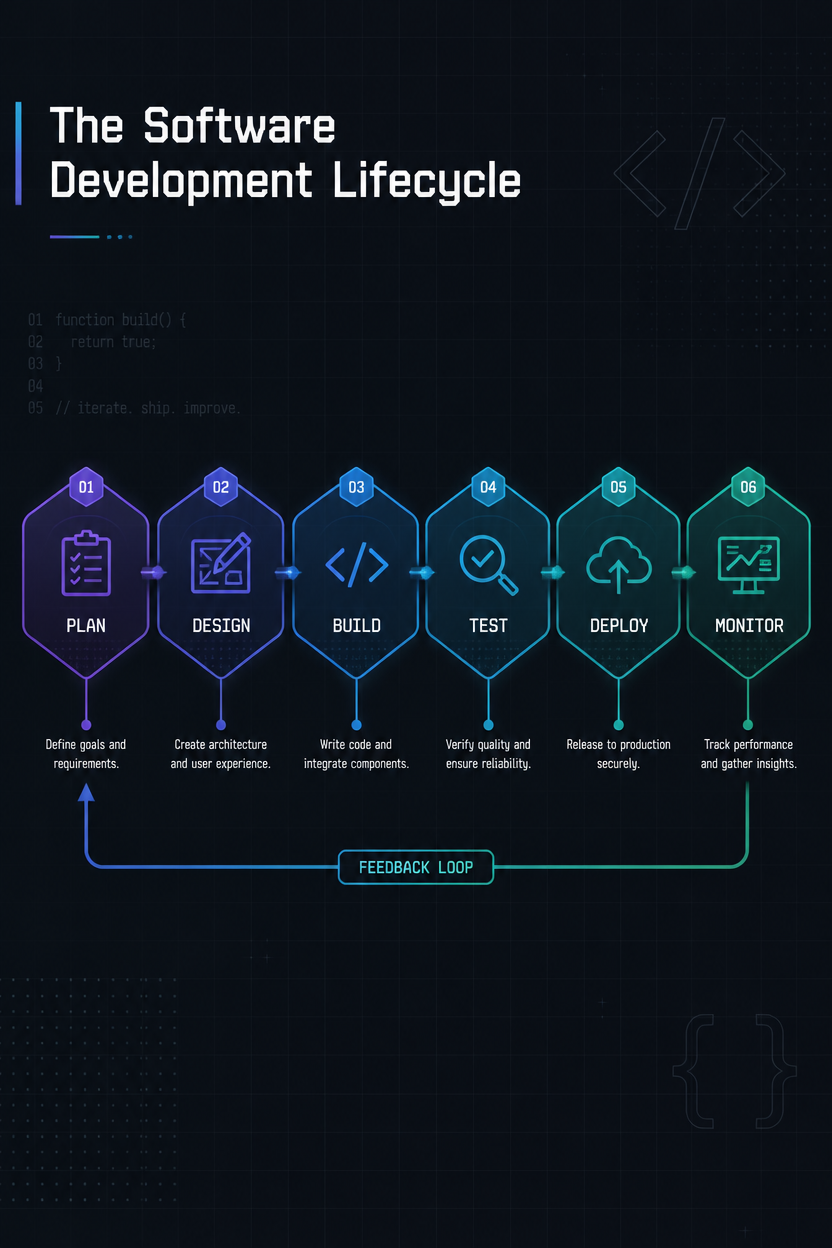
A tech process infographic of the software development lifecycle shown as a horizontal pipeline. Stages - plan, design, build, test, deploy, monitor - appear as connected hexagonal nodes with matching icons and a one-line goal each, plus a feedback arrow looping from monitor back to plan. Modern dark-UI aesthetic, indigo-and-teal gradient nodes on charcoal, monospace labels. Title 'The Software Development Lifecycle' top-left in a clean geometric font, a subtle grid and code-bracket motif in the background.

Example generated from “Turn Scraps into Soil”
GPT Image 2en

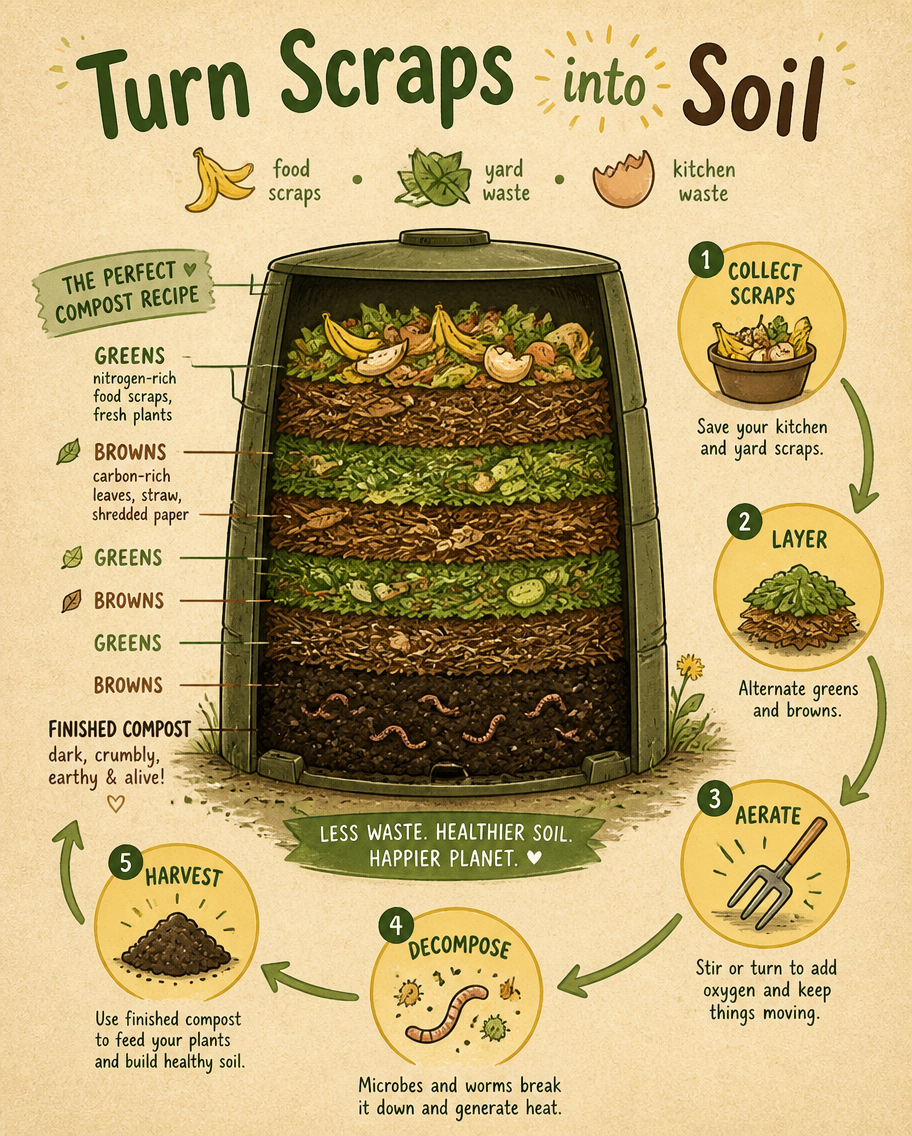
A gardening process infographic explaining home composting as a layered cutaway of a compost bin plus a circular flow. The bin cross-section shows alternating 'greens' and 'browns' layers, worms, and finished dark compost at the base; a surrounding loop diagram labels 'collect scraps', 'layer', 'aerate', 'decompose', 'harvest'. Hand-drawn earthy illustration, soil-brown, leaf-green and sunny-yellow palette on recycled-paper beige. Friendly rounded title 'Turn Scraps into Soil' at the top, small icons for a banana peel, leaves and an eggshell.

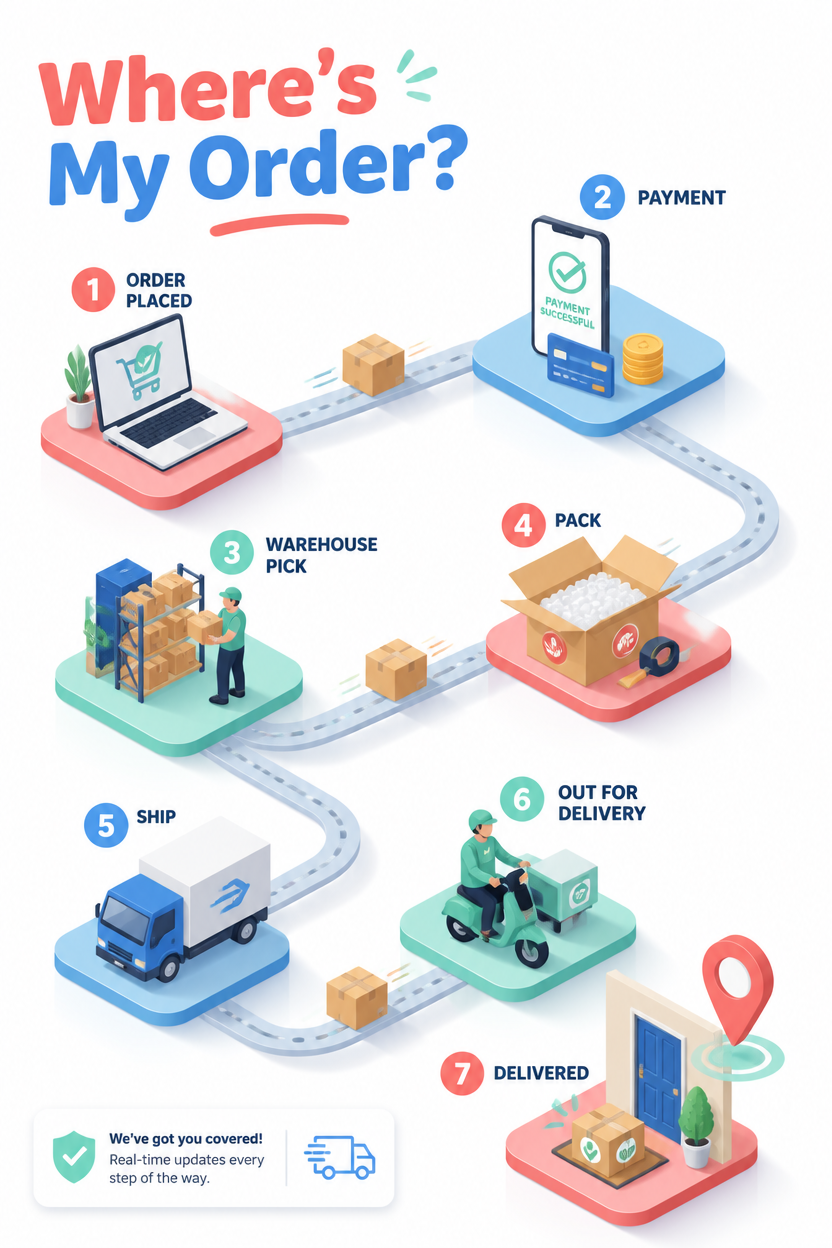
Example generated from “Where's My Order?”
GPT Image 2en

A logistics flow infographic showing an online order's journey from click to doorstep. An isometric path links 'order placed', 'payment', 'warehouse pick', 'pack', 'ship', 'out for delivery', 'delivered', each on a small 3D platform with an icon and a step number. A bright friendly palette of coral, sky-blue and mint on white, soft isometric illustration with long shadows. A dotted conveyor route with a moving parcel motif. Bold rounded title 'Where's My Order?' upper-left, a small map pin at the final step.

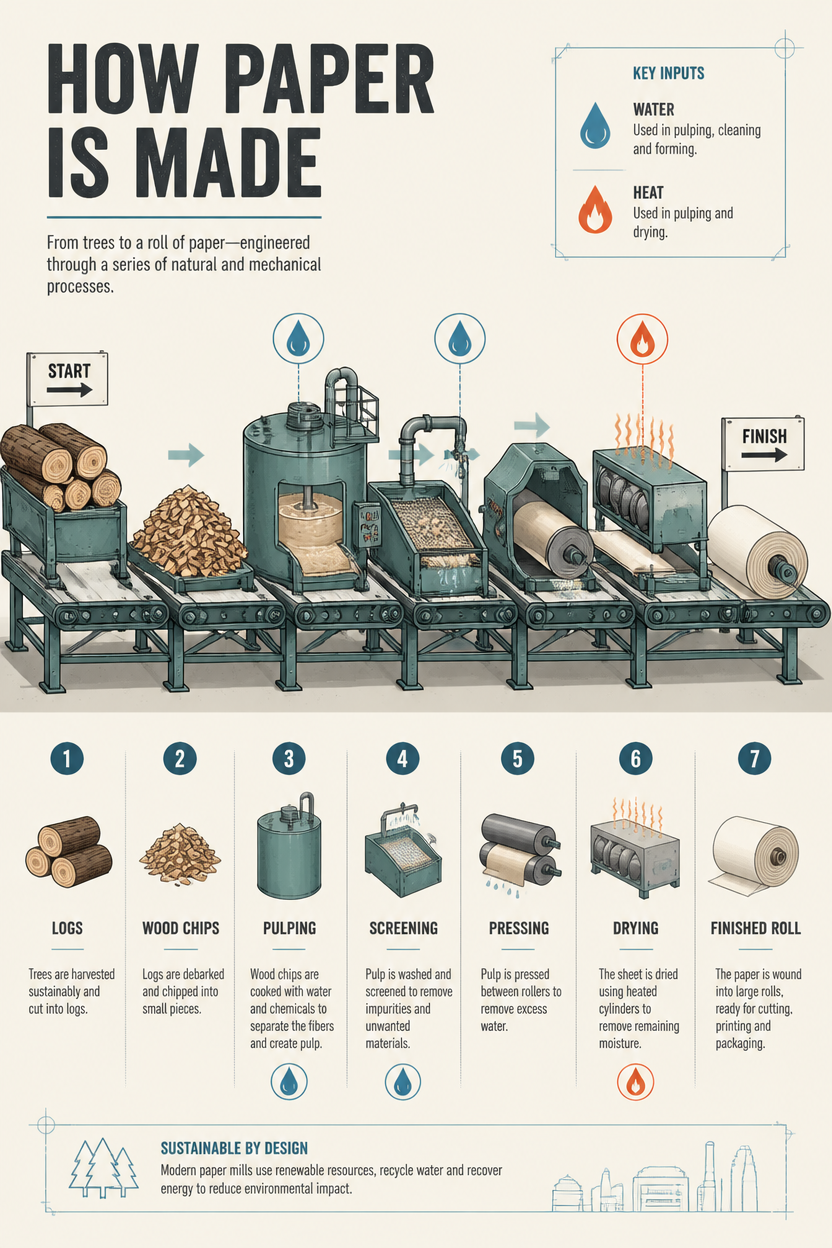
Example generated from “How Paper Is Made”
GPT Image 2en

A manufacturing process infographic of how paper is made, shown as a factory line flowing left to right. Illustrated stages - logs, wood chips, a pulping vat, screening, pressing rollers, drying, and a finished paper roll - connect via a conveyor with numbered steps and short captions. Clean industrial flat style, muted teal machinery, kraft-brown and grey palette on off-white, thin blueprint accent lines. Title 'How Paper Is Made' bold at top-left, small water-drop and heat icons marking key inputs.

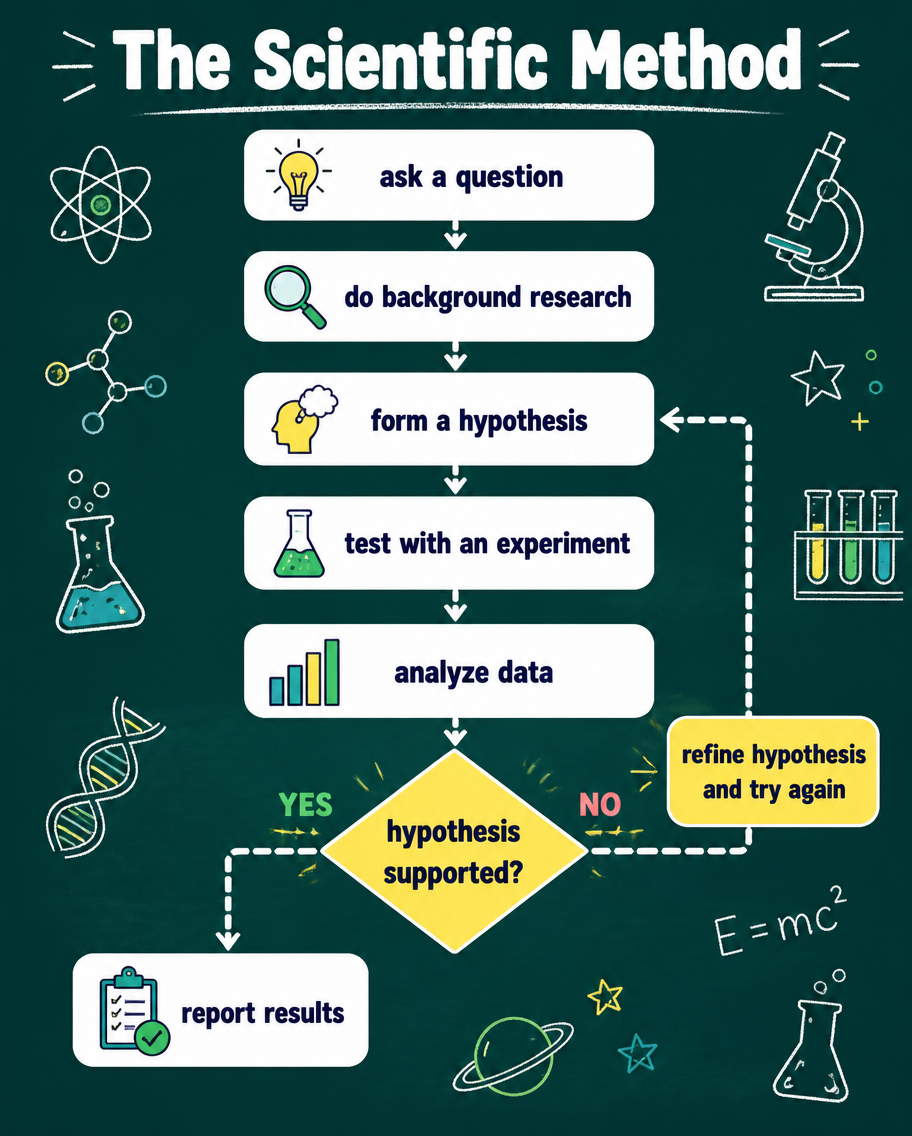
Example generated from “The Scientific Method”
GPT Image 2en

An education flowchart infographic of the scientific method drawn as a top-to-bottom decision diagram. Rounded boxes read 'ask a question', 'do background research', 'form a hypothesis', 'test with an experiment', 'analyze data', then a decision diamond 'hypothesis supported?' branching to 'report results' or looping back to refine. Crisp flat vector, a chalkboard-teal background with white and lemon-yellow nodes, playful science icons (flask, magnifier, lightbulb). Bold title 'The Scientific Method' at the top, dashed arrows between steps.

Example generated from “Support Decision Tree”
GPT Image 2en

A UX process infographic laid out as a customer-support decision tree for a fictional app 'BrightDesk'. A top question 'What's your issue?' branches through diamonds - 'account?', 'billing?', 'bug?' - into rounded outcome cards with recommended actions and an icon each. Clean modern flat style, a soft lavender-and-white palette with a coral accent for endpoints, connector lines with directional arrows. Monospace step labels, bold title 'Support Decision Tree' upper-left, a small chat-bubble mascot in the corner.

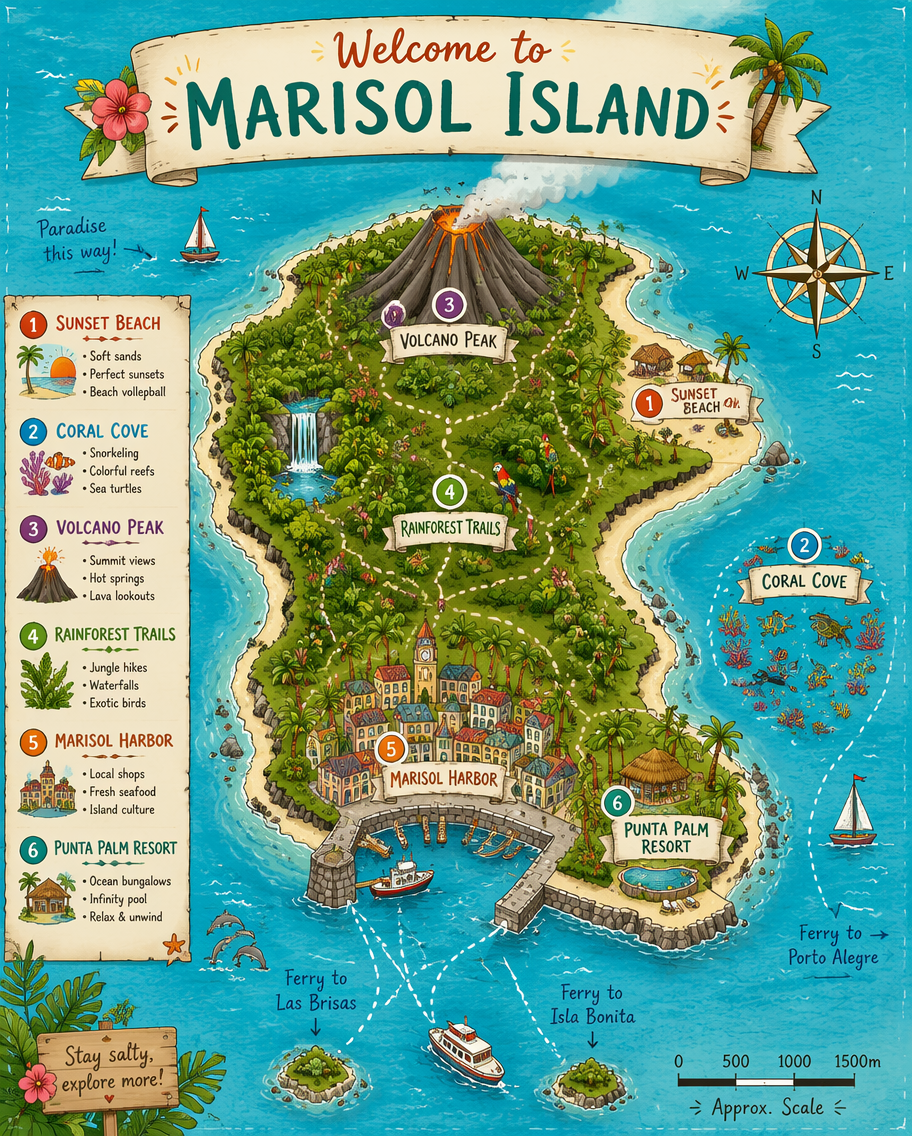
Example generated from “Welcome to Marisol Island”
GPT Image 2en

A playful illustrated tourist map of the fictional tropical island 'Marisol'. A top-down stylized map shows beaches, a volcano, rainforest trails, a harbor town and coral snorkel spots, each with a cute icon, a name label and a numbered legend of attractions. Hand-drawn cartographic style, vibrant turquoise sea, sandy coast and jungle-green, with a compass rose, scale bar and dotted ferry routes. A decorative title banner 'Welcome to Marisol Island' at the top, tiny palm and sailboat doodles scattered around.

Example generated from “Journey of a River”
GPT Image 2en

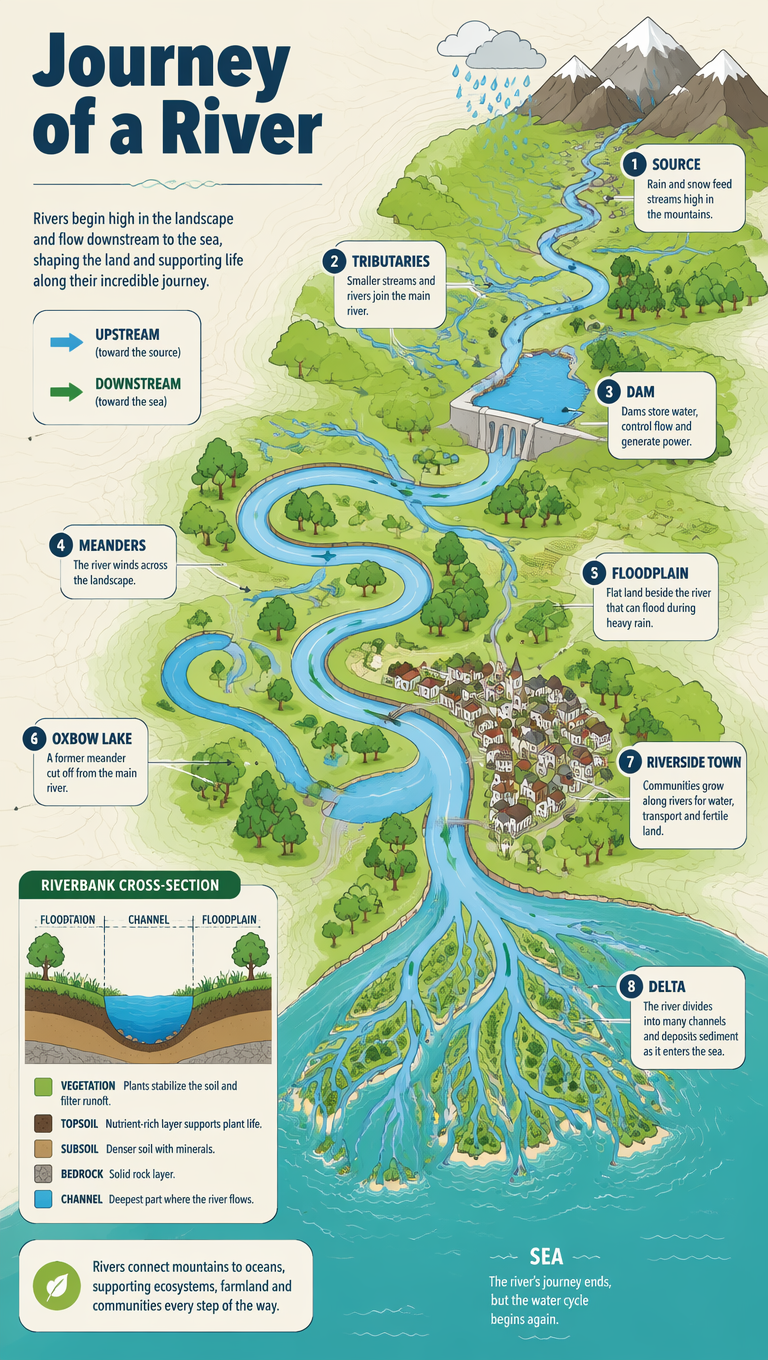
A geography infographic explaining a river system from source to sea, drawn as a top-down flowing map. Labeled features - source, tributaries, meanders, floodplain, oxbow lake and a branching delta - trace the blue river across green land into a teal ocean. Icons for rainfall, a dam and a riverside town appear along the way. Clean flat cartographic style, a fresh green-and-blue palette on cream, thin contour lines. Bold title 'Journey of a River' top-left, a small arrow legend for upstream and downstream, a cross-section inset of the riverbank.

Example generated from “How Solar Panels Work”
GPT Image 2en

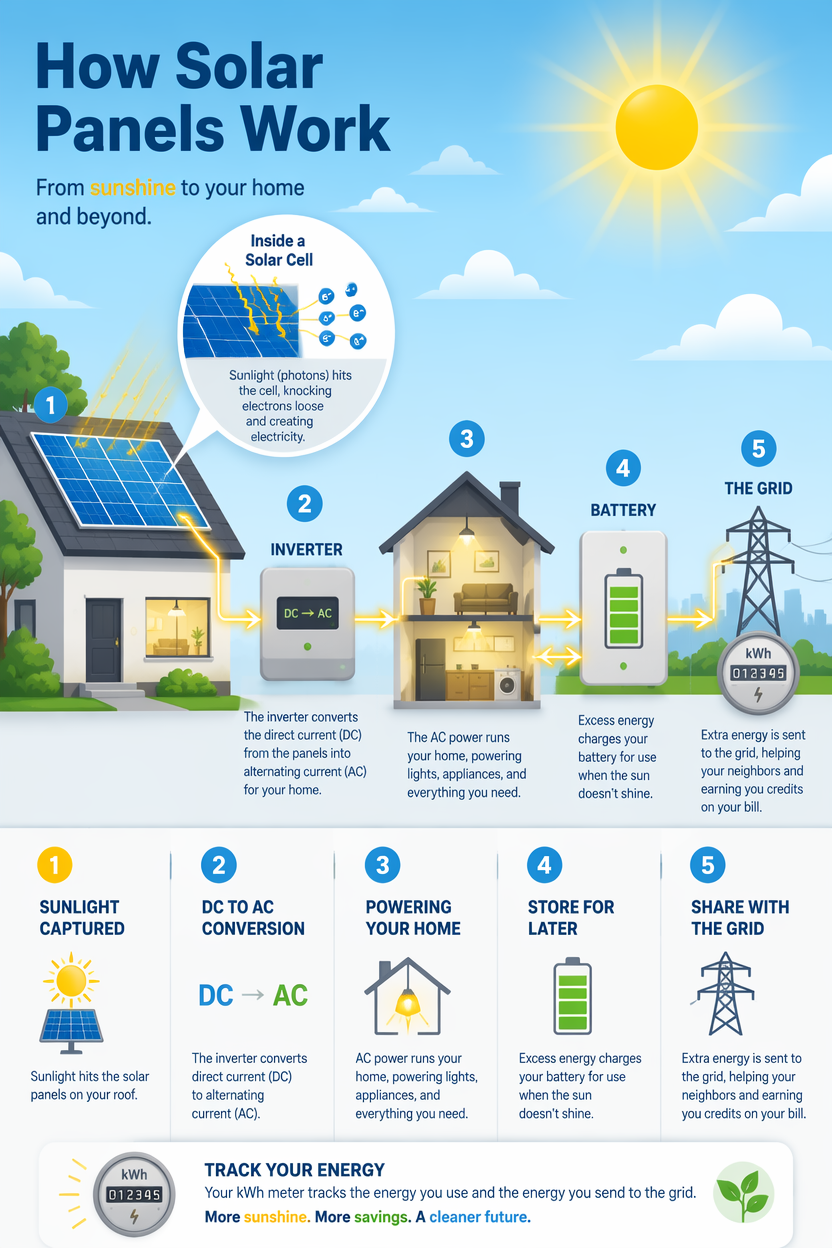
A clean-tech infographic explaining how a solar panel powers a home, drawn as a left-to-right energy flow. Sunlight hits a rooftop panel (a zoomed inset shows photovoltaic cells knocking electrons loose), current runs to an inverter converting DC to AC, then to a house and a battery, with excess feeding the grid. A bright optimistic palette of sky-blue, sunny-yellow and slate, flat vector with soft gradients. Numbered steps 1-5, bold title 'How Solar Panels Work' top-left, a glowing arrow flow, a small kWh meter icon.

Example generated from “How Wi-Fi Works”
GPT Image 2en

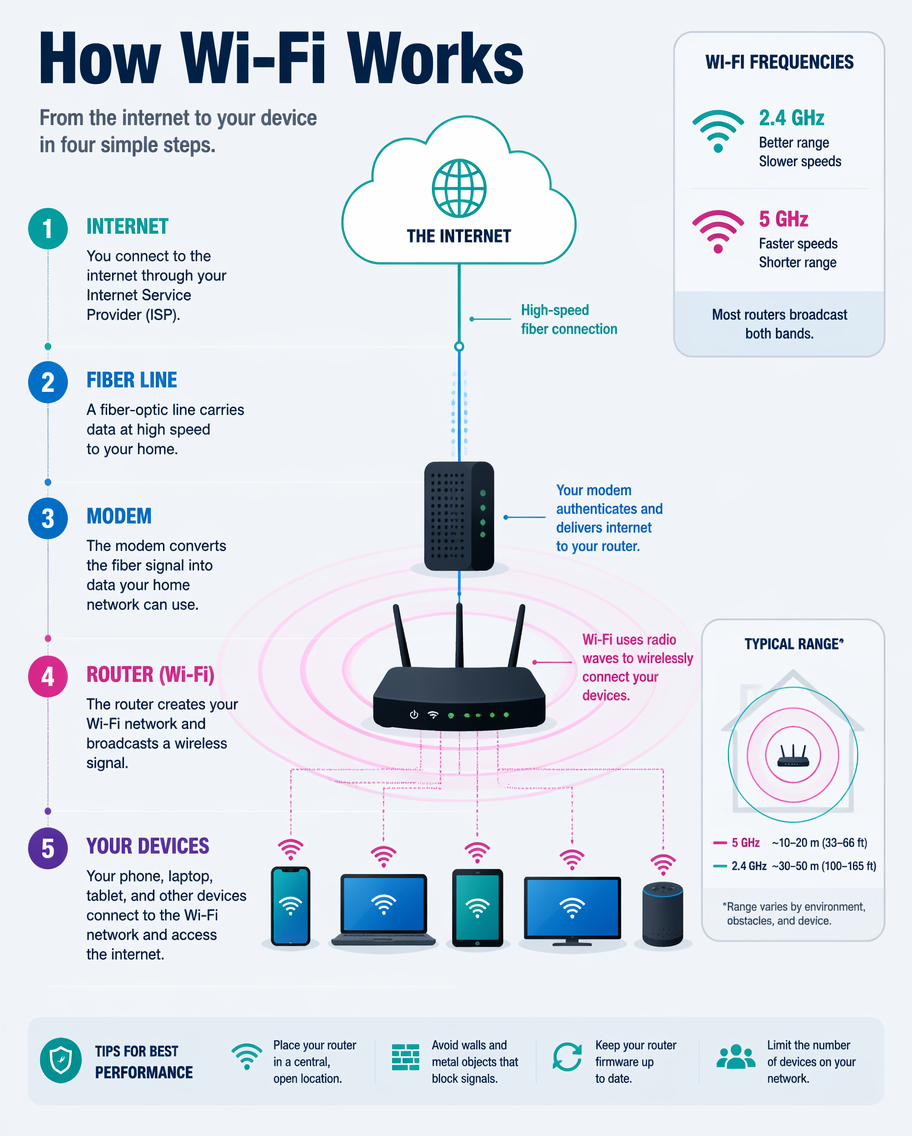
A technology infographic explaining how Wi-Fi delivers internet, shown as a layered flow from the internet cloud to a phone. Stages - a fiber line, a modem, a router broadcasting radio waves, and connecting devices - each carry an icon, with concentric signal-wave rings radiating from the router. Clean modern flat style, a cool blue-and-teal palette with a magenta signal accent on light grey. Numbered captions, bold title 'How Wi-Fi Works' upper-left, a small frequency badge (2.4 vs 5 GHz) and a range diagram in the corner.

Example generated from “How an Electric Car Works”
GPT Image 2en

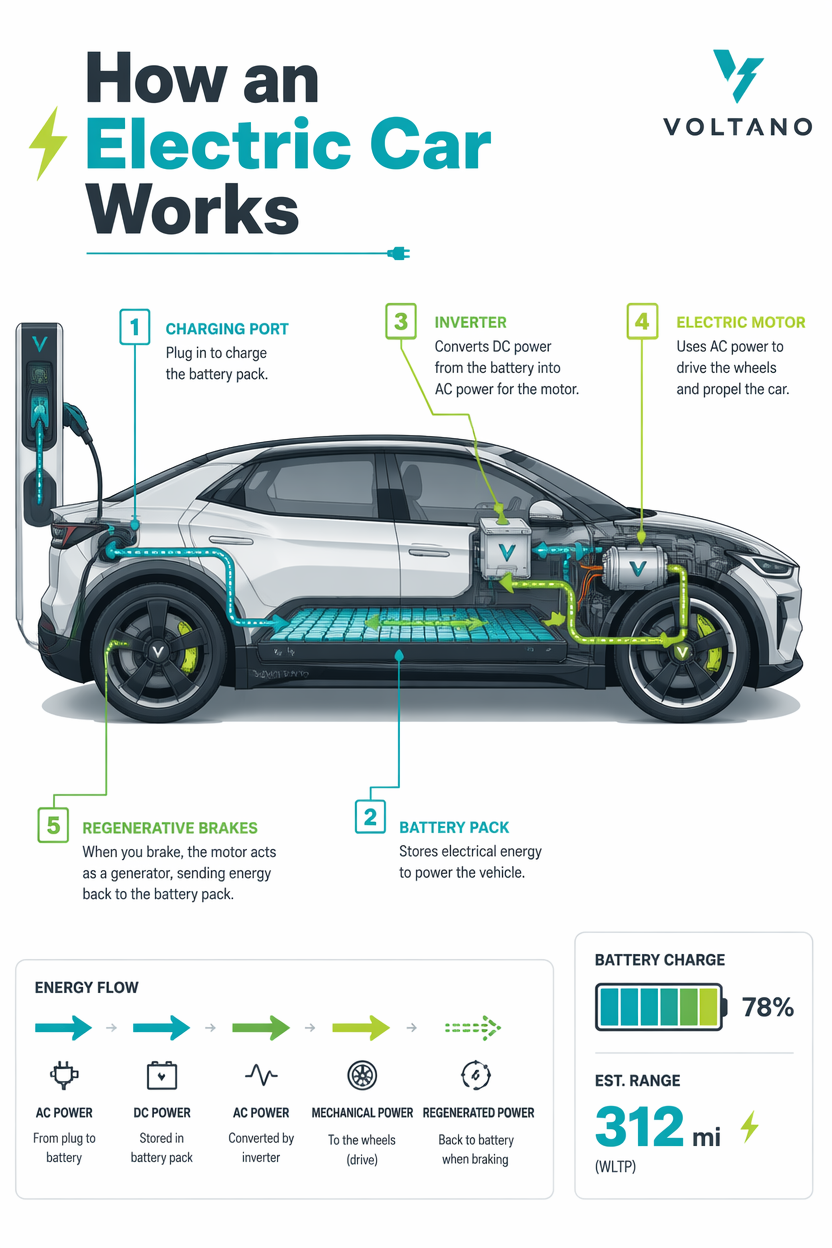
A technology infographic of how an electric car works, drawn as a cutaway side view of a stylized EV (invented brand 'Voltano'). Labeled components - a battery pack under the floor, an electric motor, an inverter, a charging port, and regenerative brakes - connect with colored energy-flow arrows from plug to wheels. Sleek modern flat illustration, an electric-teal, graphite and lime-accent palette on white. Numbered leader labels, bold title 'How an Electric Car Works' top-left, a small battery-charge gauge and range figure as accents.

Example generated from “How GPS Locates You”
GPT Image 2en

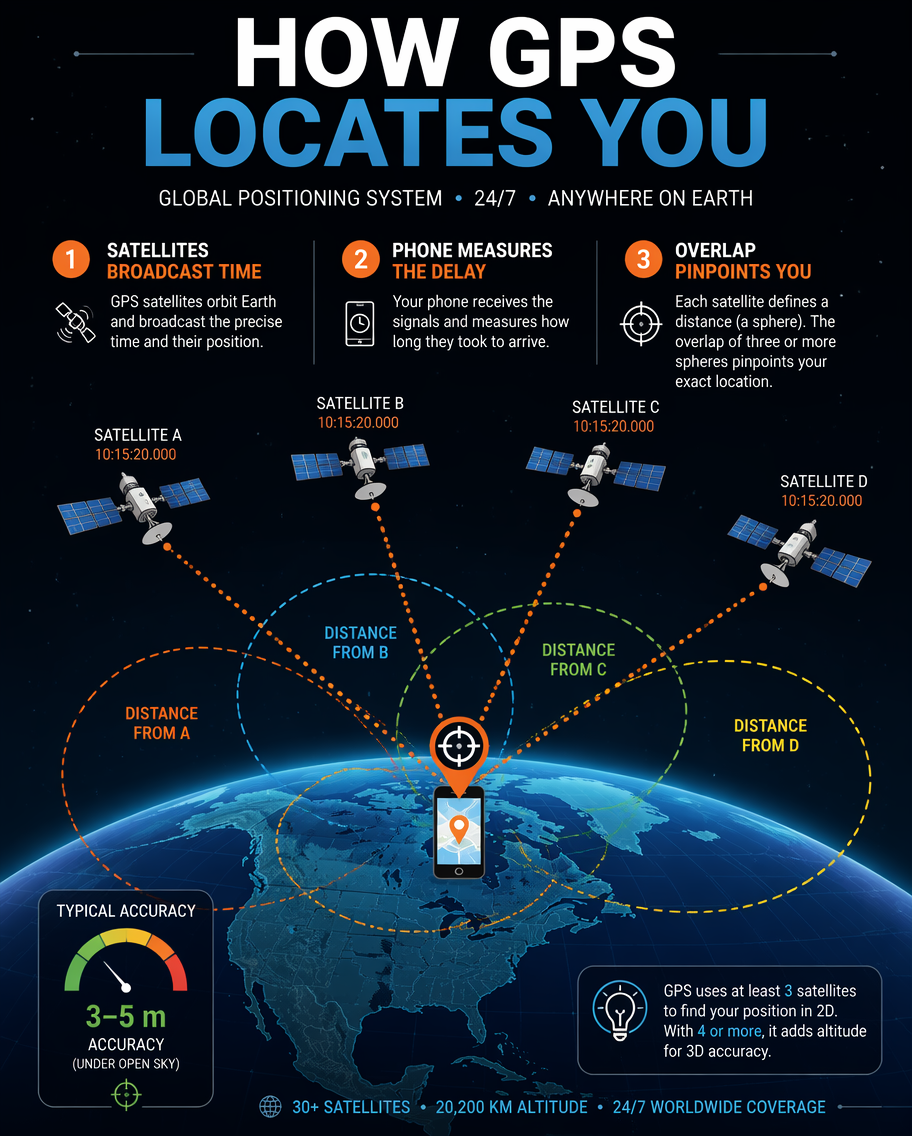
A technology infographic explaining how GPS finds your location, drawn as a scene with three or four satellites beaming signals down to a phone on a stylized globe. Dotted signal lines and expanding range circles illustrate trilateration; numbered captions explain 'satellites broadcast time', 'phone measures delay', 'overlap pinpoints you'. A space-dark background with earth-blue and orange signal accents, clean flat vector. Bold title 'How GPS Locates You' at the top, a small crosshair pin and accuracy-meter icon.

Example generated from “Inside a Jet Engine”
GPT Image 2en

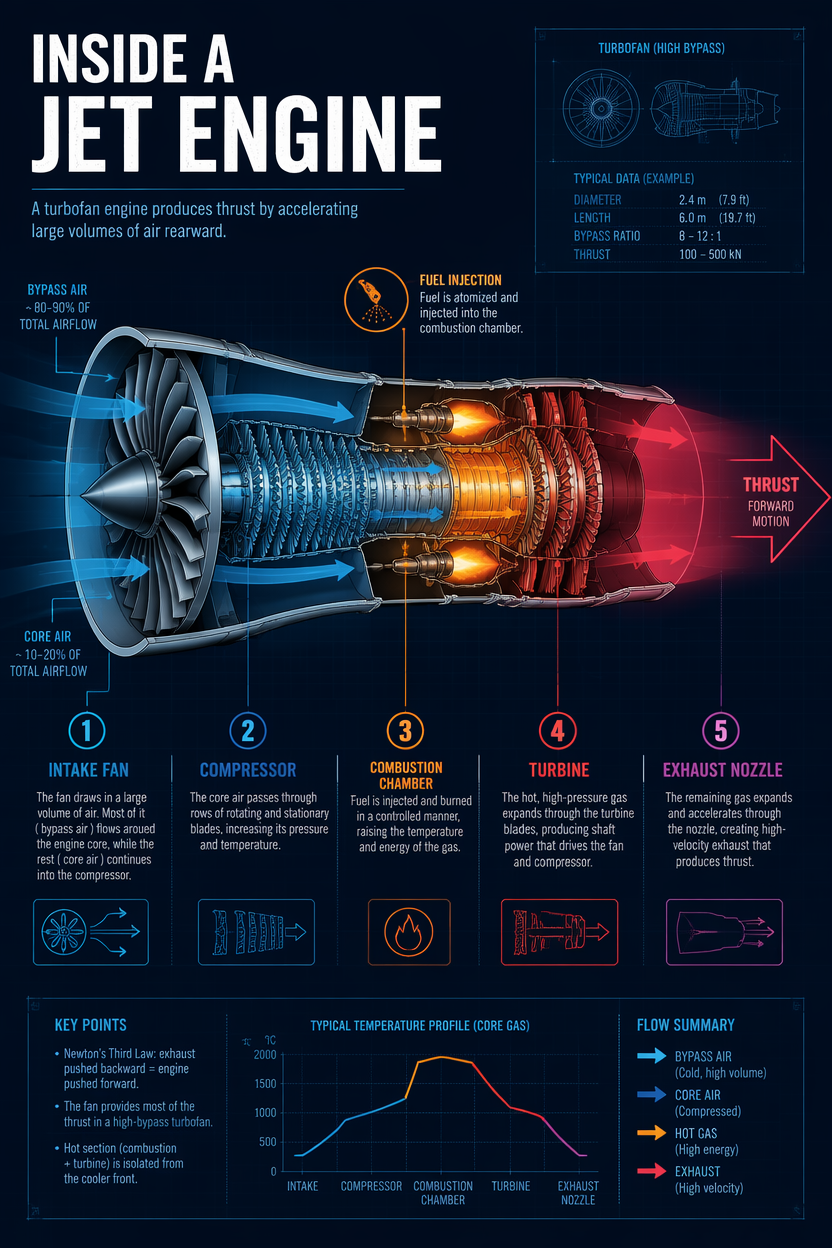
An engineering infographic of how a jet engine works, drawn as a detailed cutaway of a turbofan flowing left to right. Labeled stages - intake fan, compressor, combustion chamber, turbine, exhaust nozzle - are color-zoned from cool intake-blue to hot combustion-orange, with airflow arrows and a fuel-injection icon. Semi-technical flat illustration with thin blueprint accents on a dark navy background. Bold uppercase title 'Inside a Jet Engine' top-left, numbered callouts, a small thrust arrow at the nozzle.

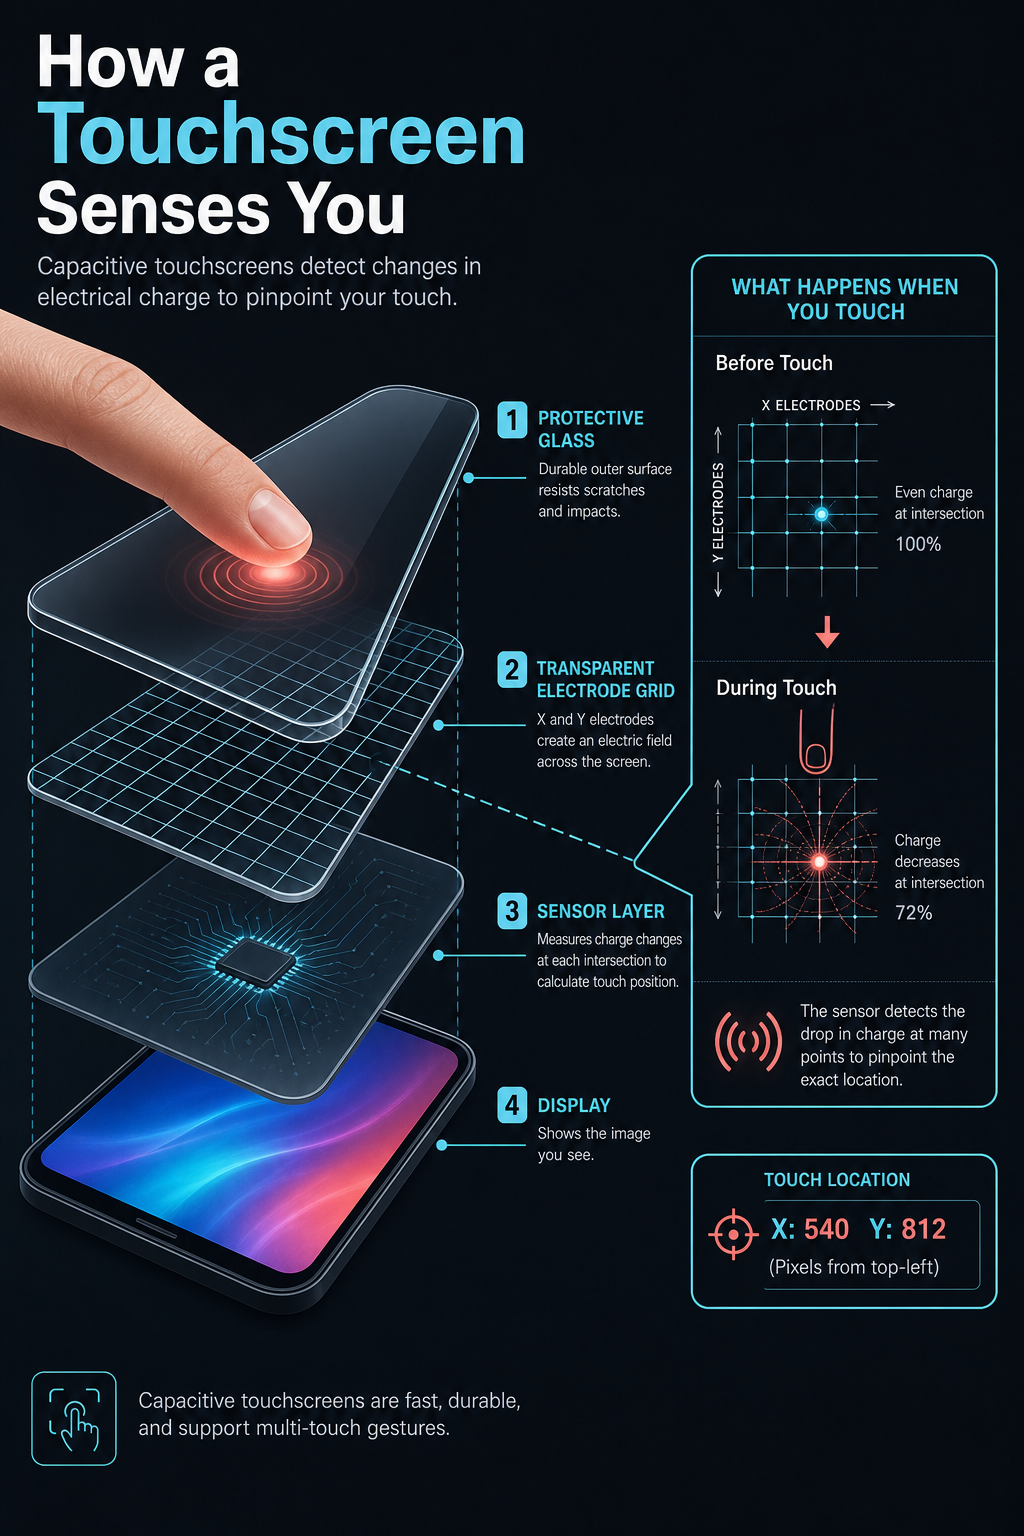
Example generated from “How a Touchscreen Senses You”
GPT Image 2en

A technology infographic explaining how a capacitive touchscreen works, shown as an exploded layer stack of a phone screen. Labeled layers - protective glass, a transparent electrode grid, a sensor layer, and the display - separate vertically; a fingertip touches the top, and a zoomed inset shows the electrical charge change detected at the grid. A clean tech aesthetic, a cool grey-and-cyan palette with a coral touch-point accent on dark charcoal. Bold title 'How a Touchscreen Senses You' top-left, numbered layer labels, a small grid-coordinate readout.

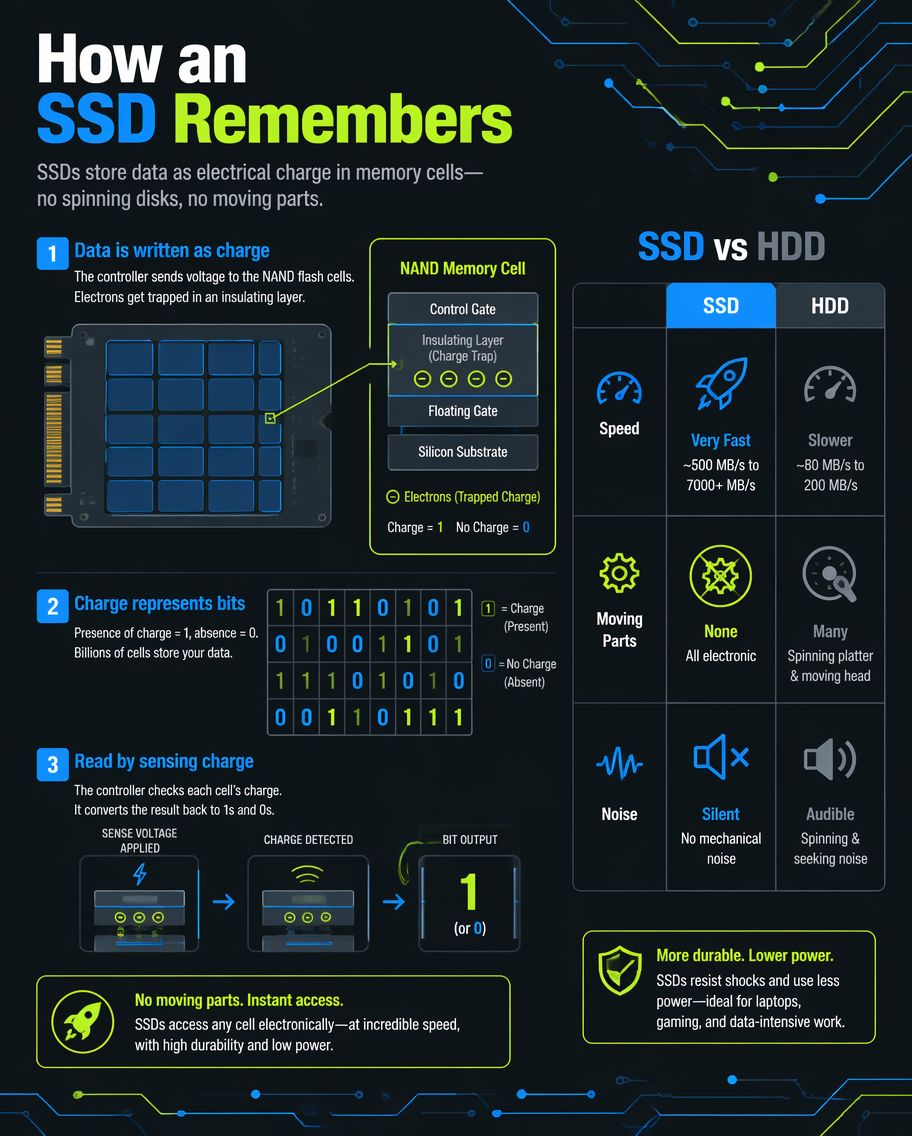
Example generated from “How an SSD Remembers”
GPT Image 2en

A technology infographic explaining how a solid-state drive stores data, contrasting it with a spinning hard drive. Left: a stylized SSD chip grid with a zoomed inset of memory cells holding 1s and 0s as trapped charge; right: a mini comparison table of SSD vs HDD (speed, moving parts, noise). A clean tech palette of electric blue, slate and lime on dark grey, flat vector with circuit accents. Bold title 'How an SSD Remembers' top-left, numbered captions, small bit-grid animation-style icons.

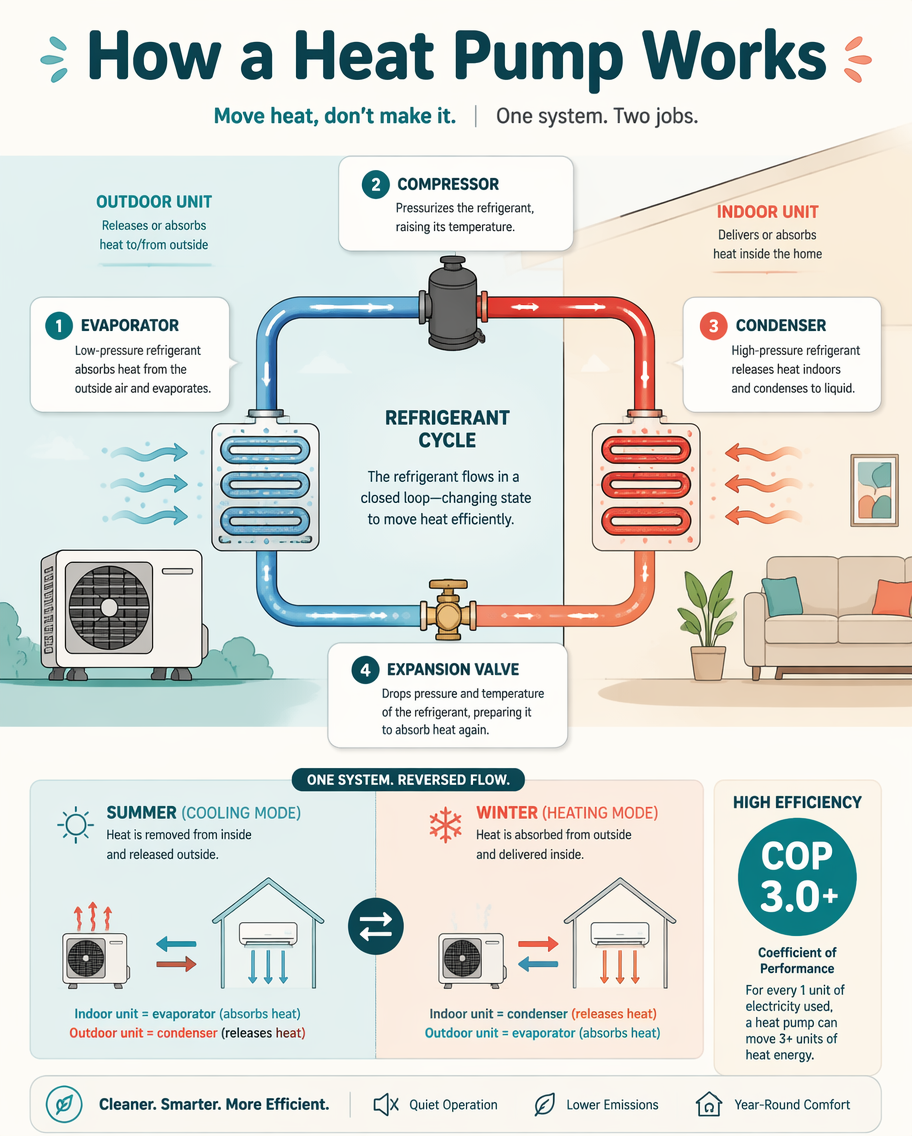
Example generated from “How a Heat Pump Works”
GPT Image 2en

A home-tech infographic explaining how a heat pump heats and cools a house, drawn as a looping refrigerant cycle between an outdoor and indoor unit. Labeled stages - evaporator, compressor, condenser, expansion valve - carry colored arrows (blue for cold, red for warm) around the loop, with a summer/winter toggle showing reversed flow. Clean flat illustration, a cool-and-warm split palette of teal and coral on off-white. Bold rounded title 'How a Heat Pump Works' at the top, numbered steps, a small efficiency (COP) badge.

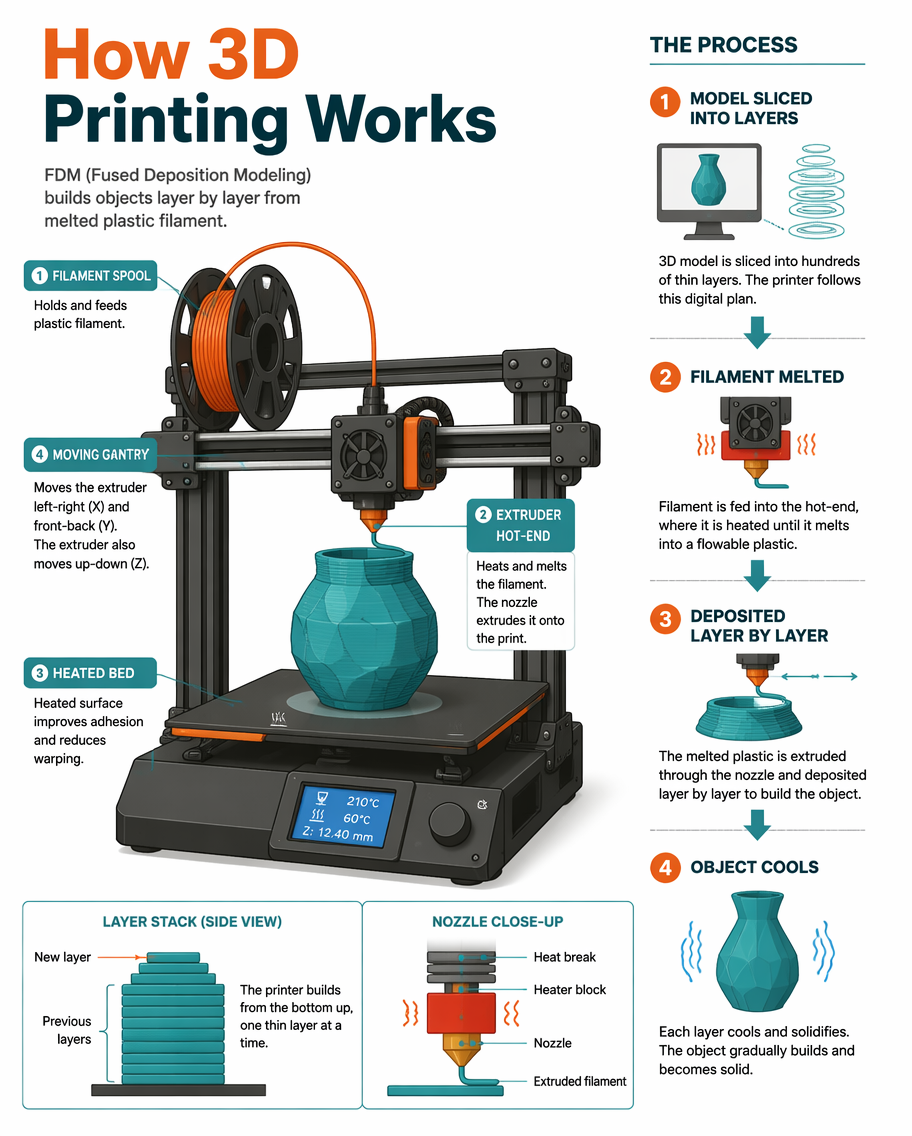
Example generated from “How 3D Printing Works”
GPT Image 2en

A maker-tech infographic explaining how an FDM 3D printer builds an object, drawn as a labeled machine diagram with a step flow. Components - a filament spool, an extruder hot-end, a heated bed, a moving gantry - are labeled; a numbered sequence shows 'model sliced into layers', 'filament melted', 'deposited layer by layer', 'object cools'. Clean flat illustration, a friendly orange-teal-and-grey palette on white, a half-printed object on the bed. Bold title 'How 3D Printing Works' top-left, a small layer-stack inset and a nozzle close-up.

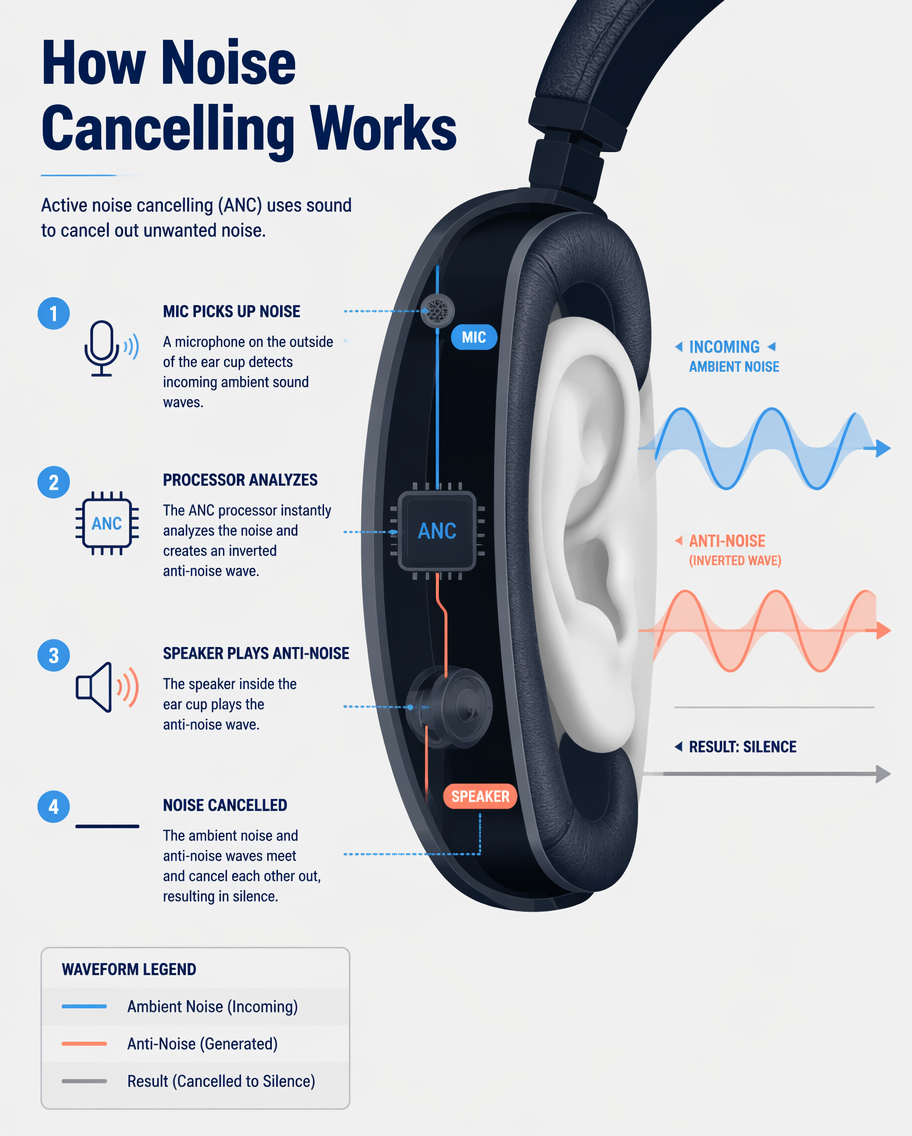
Example generated from “How Noise Cancelling Works”
GPT Image 2en

A technology infographic explaining active noise cancelling in headphones, drawn as a cross-section of an ear cup around an ear. Incoming ambient sound waves meet an inverted 'anti-noise' wave generated by the headphone, and the two flatten to silence - shown with layered blue and orange waveforms plus a small mic and speaker icon inside. Sleek modern flat style, a deep-navy, cyan and coral palette on light grey. Bold title 'How Noise Cancelling Works' top-left, numbered captions, a waveform legend.