Documento original
GPT Image 2 · en
{
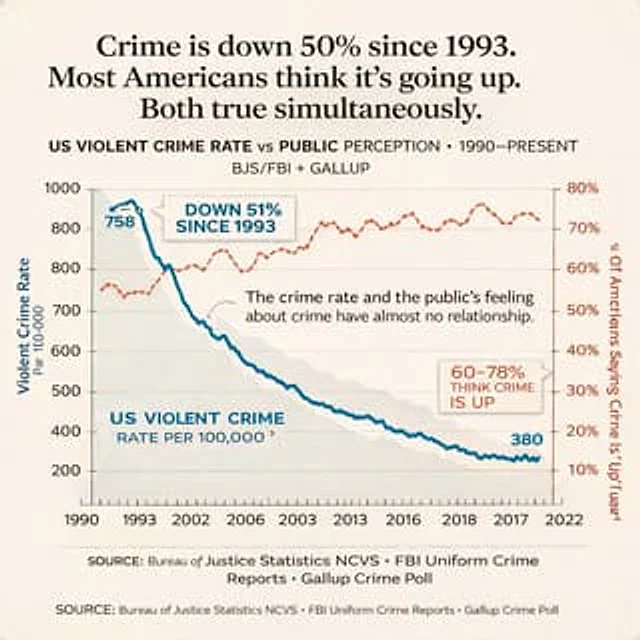
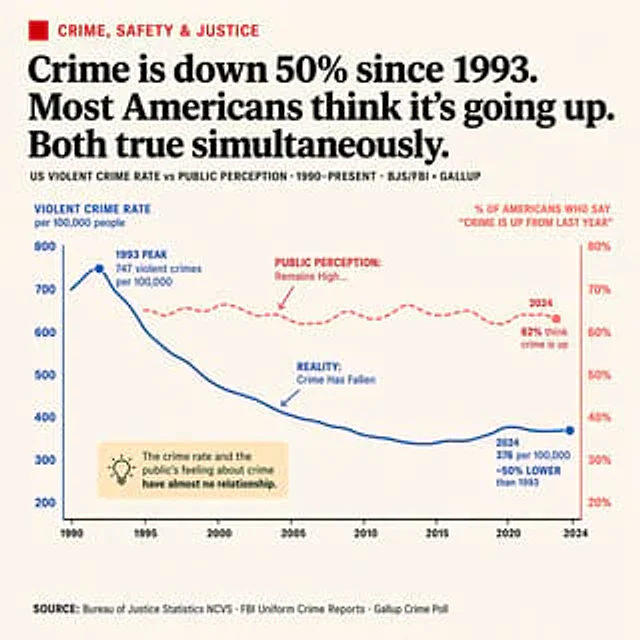
  "type": "Editor-level infographic dual-axis line chart",
  "style": "Simple, newspaper-style layout with off-white background and highly readable typography.",
  "header": {
    "category": "Crime, Security, and Justice (red text with red square icons)",
    "headline": "{argument name=\"main headline\" default=\"Since 1993, the crime rate has decreased by 50%. However, most Americans believe the crime rate is rising. Both are true.\"}",
    "sub_headline": "US Violent Crime Rate vs. Public Perception: 1990-Present - BJS/FBI + GALLUP"
  },
  "chart": {
    "x_axis": "From 1990 to 2024, there are a total of 8 scales.",
    "left_y_axis": {
      "color": "blue",
      "label": "{argument name=\"left axis label\" default=\"violent crime rate per 100,000 people\"}",
      "range": "200 to 800"
    },
    "right_y_axis": {
      "color": "red",
      "label": "{argument name=\"right axis label\" default=\"The percentage of Americans who believe 'crime rate has increased compared to last year'\"}",
      "range": "20% to 80%"
    },
    "data_series": [
      {
        "name": "reality",
        "style": "solid blue line",
        "trend": "It peaks early and then declines significantly.",
        "annotations": [
          "Peak in 1993: 747 violent crimes per 100,000 people (marked with blue dots)",
          "Reality: Crime rates have decreased (blue arrows pointing to lines).",
          "2024: 376 cases per 100,000 people, a decrease of about 50% compared to 1993 (marked with blue dots)."
        ]
      },
      {
        "name": "Public perception",
        "style": "Red dashed line",
        "trend": "Remaining relatively stable and at a high level",
        "annotations": [
          "Public perception: Maintaining a high level of awareness... (red arrow pointing to the target)",
          "2024: 62% of people believe the crime rate is rising (marked with a red dot)."
        ]
      }
    ]
  },
  "callout_box": {
    "position": "bottom left corner of the chart area",
    "style": "light yellow rectangle",
    "icon": "Light bulb",
    "text": "{argument name=\"callout text\" default=\"There is almost no correlation between crime rates and public perception of crime.\"}"
  },
  "footer": {
    "text": "Data source:{argument name=\"footer source\" default=\"Bureau of Justice Statistics (NCVS), FBI Unified Crime Report, Gallup Crime Poll\"}"
  }
}
Cómo usar
- Copia el prompt original completo, incluidos los parámetros.
- Adapta el tema, el texto y la composición a tus necesidades.
- Usa una herramienta externa compatible; comprueba el acceso y el resultado.
Antes de empezar
- Comprueba si necesita una imagen de referencia. La compatibilidad no demuestra qué modelo generó el ejemplo.
- Revisa nombres, cifras y textos; el resultado puede variar entre versiones del modelo.