信息图可视化设计

信息图可视化设计

Documento original

GPT Image 2 · zh

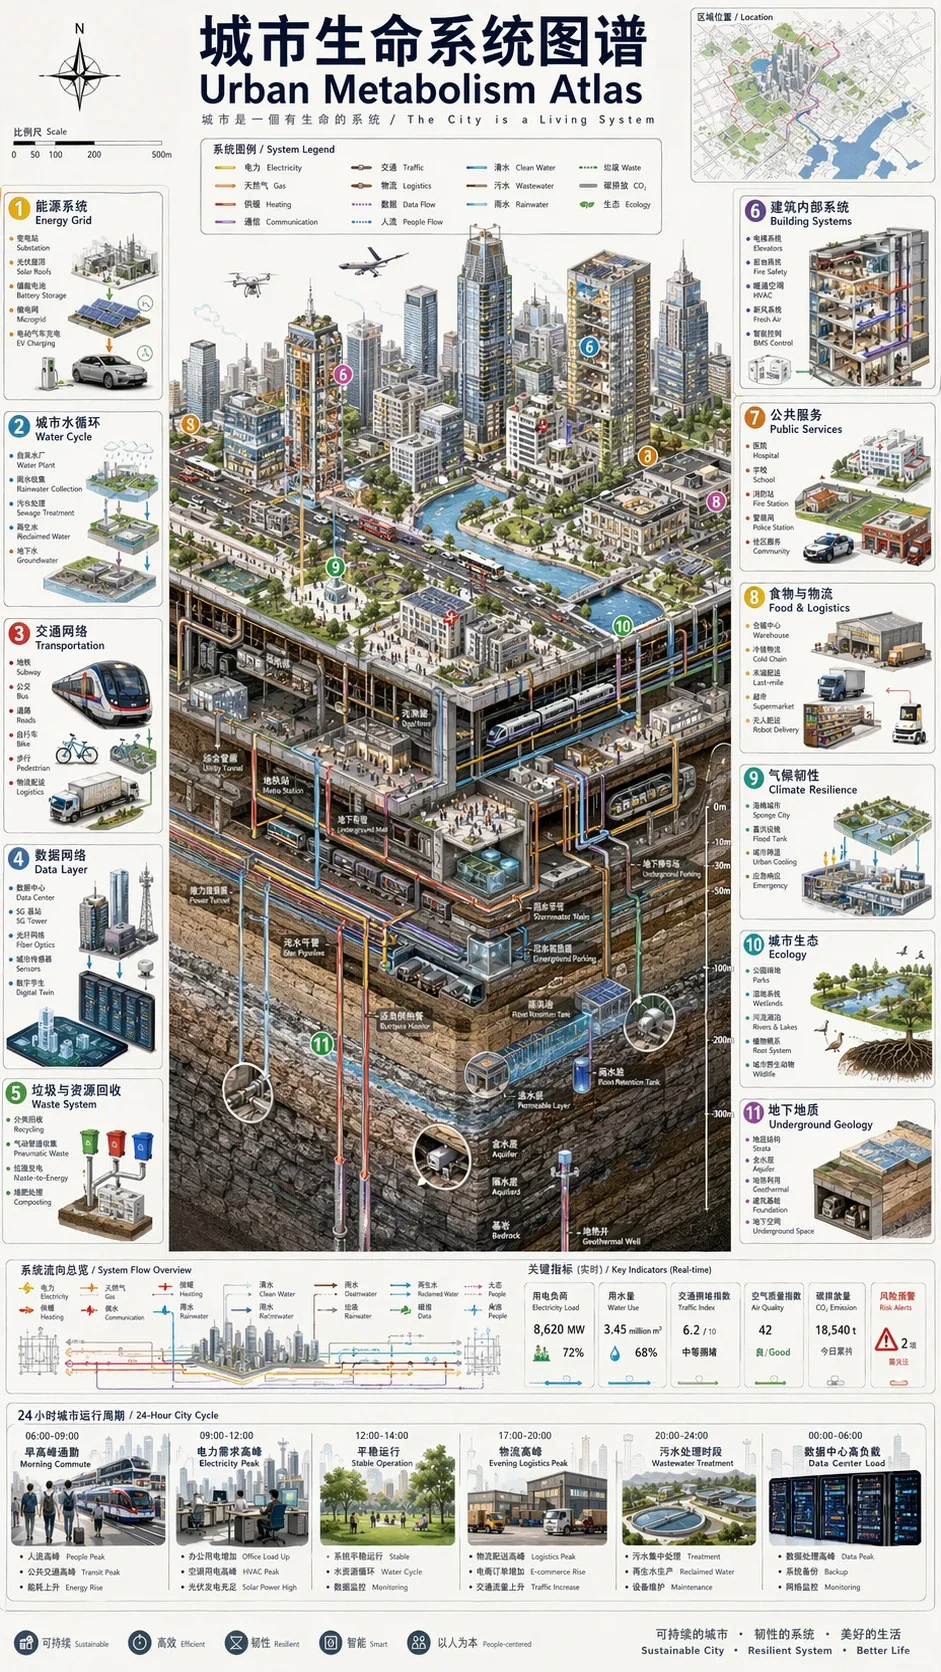
Vertical 9:16 isometric cutaway infographic "城市生命系统图谱 / Urban Metabolism Atlas". Smart city from sky to bedrock: skyscrapers, streets, subway, utility tunnels, water/sewage/gas/heating pipes, fiber, data center, flood tanks, aquifers, geothermal wells, bedrock. Color-coded flows for power/water/data/traffic/waste. 12 numbered panels bilingual CN/EN: 能源/水循环/交通/数据/垃圾/建筑/公共服务/ 物流/气候韧性/生态/地质/治理看板. 24h timeline at bottom. Style: engineering white paper + scientific atlas, light paper bg, crisp lines, 8K. No cyberpunk, no gibberish text, must show both above AND below ground.

Cómo usar

  1. Copia el prompt original completo, incluidos los parámetros.
  2. Adapta el tema, el texto y la composición a tus necesidades.
  3. Usa una herramienta externa compatible; comprueba el acceso y el resultado.

Antes de empezar

  • Comprueba si necesita una imagen de referencia. La compatibilidad no demuestra qué modelo generó el ejemplo.
  • Revisa nombres, cifras y textos; el resultado puede variar entre versiones del modelo.
Ejemplos similares

信息图可视化设计
GPT Image 2mixed

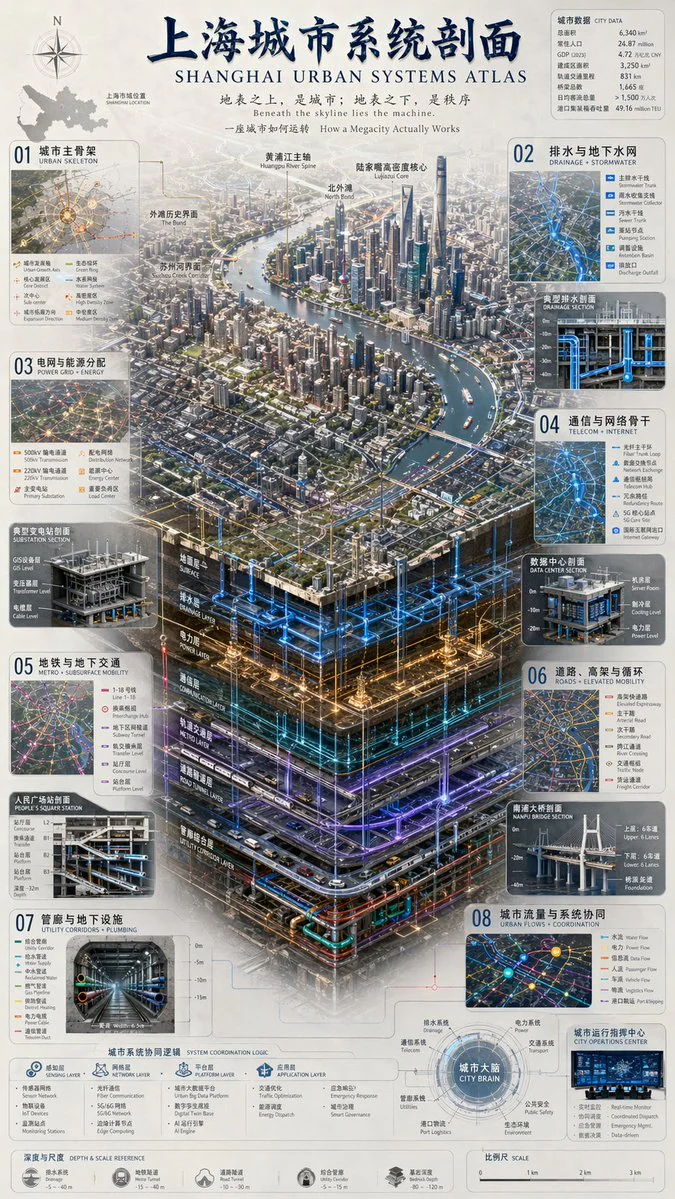
{ "type": "complex urban systems atlas infographic", "style": "{argument name=\"color palette\" default=\"dark background with glowing blue, gold, and purple accents\"}, highly detailed technical illustration, 3D isometric cutaway", "header": { "title": "{argument name=

信息图可视化设计
GPT Image 2en

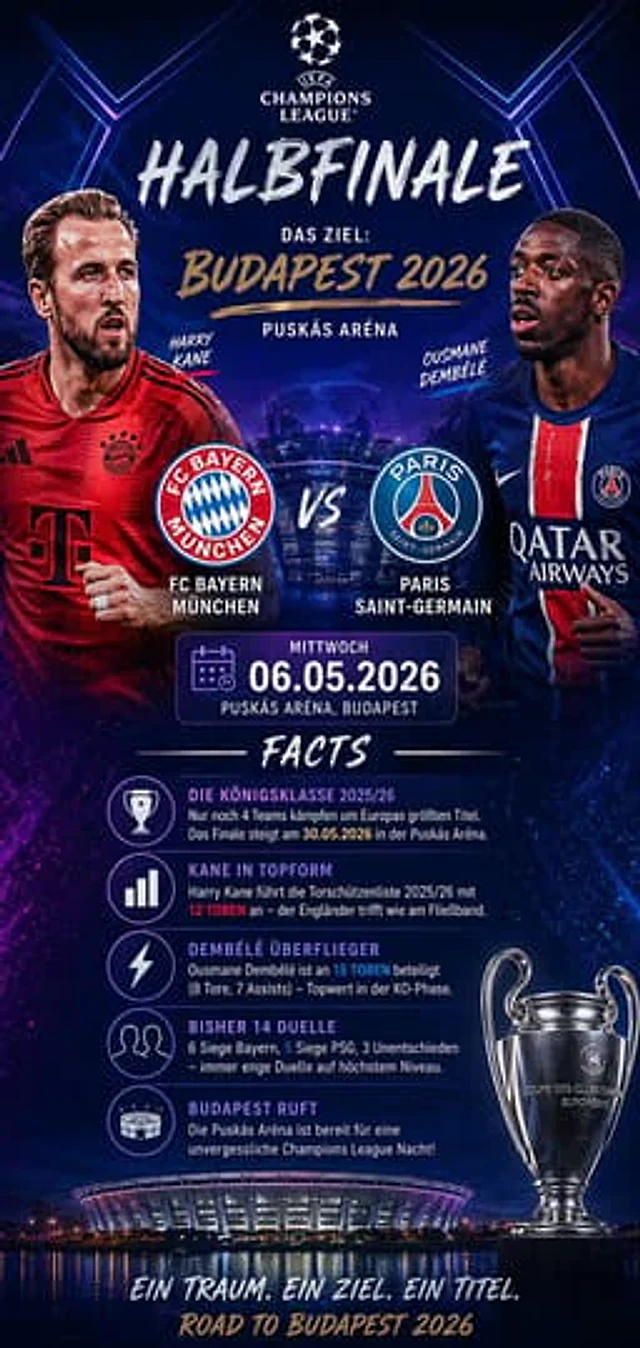
{ "type": "sports match infographic poster", "theme": "UEFA Champions League", "background": "dark blue and purple cosmic sky, glowing blue hexagonal lines, illuminated stadium reflecting on water at bottom", "header": { "logo": "UEFA Champions League", "title": "

信息图可视化设计
GPT Image 2mixed

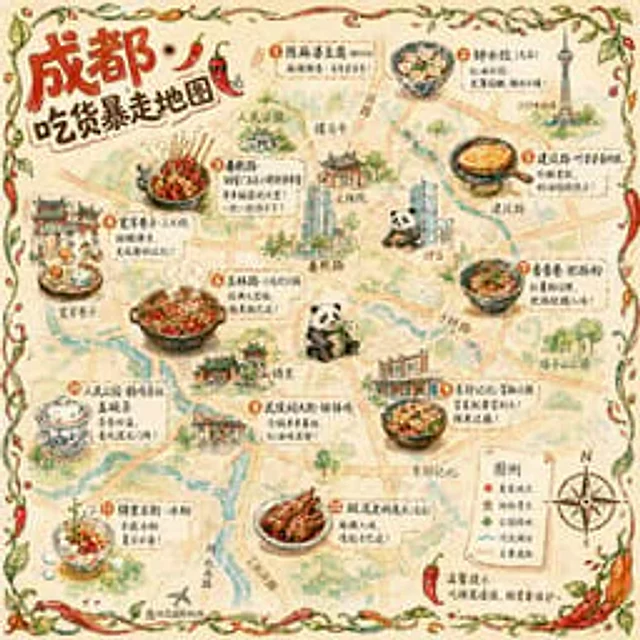
{ "type": "illustrated map infographic", "style": "{argument name=\"art style\" default=\"watercolor and ink hand-drawn illustration on vintage parchment\"}", "title_section": { "text": "{argument name=\"city name\" default=\"成都\"} {argument name=\"map title\" default=\

信息图可视化设计
GPT Image 2zh

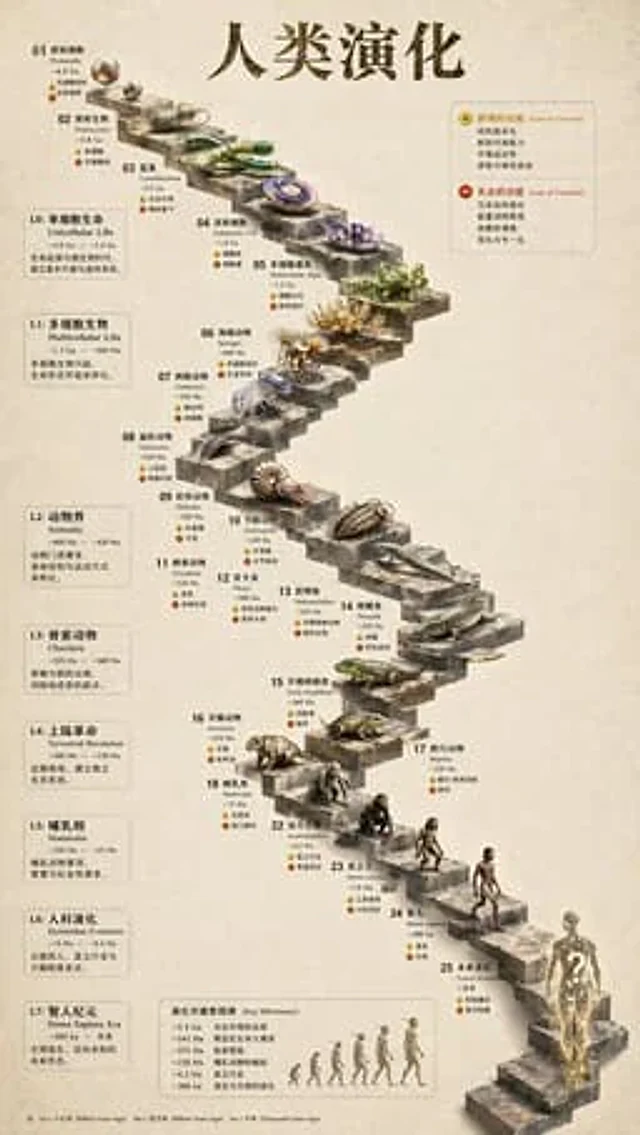
{ "type": "evolutionary timeline infographic", "instruction": "Using REFERENCE_0 as a structural base, transform the flat vector design into a highly realistic 3D infographic. Replace the smooth ramps with distinct stone steps and upgrade all organisms to photorealistic 3D mo

信息图可视化设计
GPT Image 2mixed

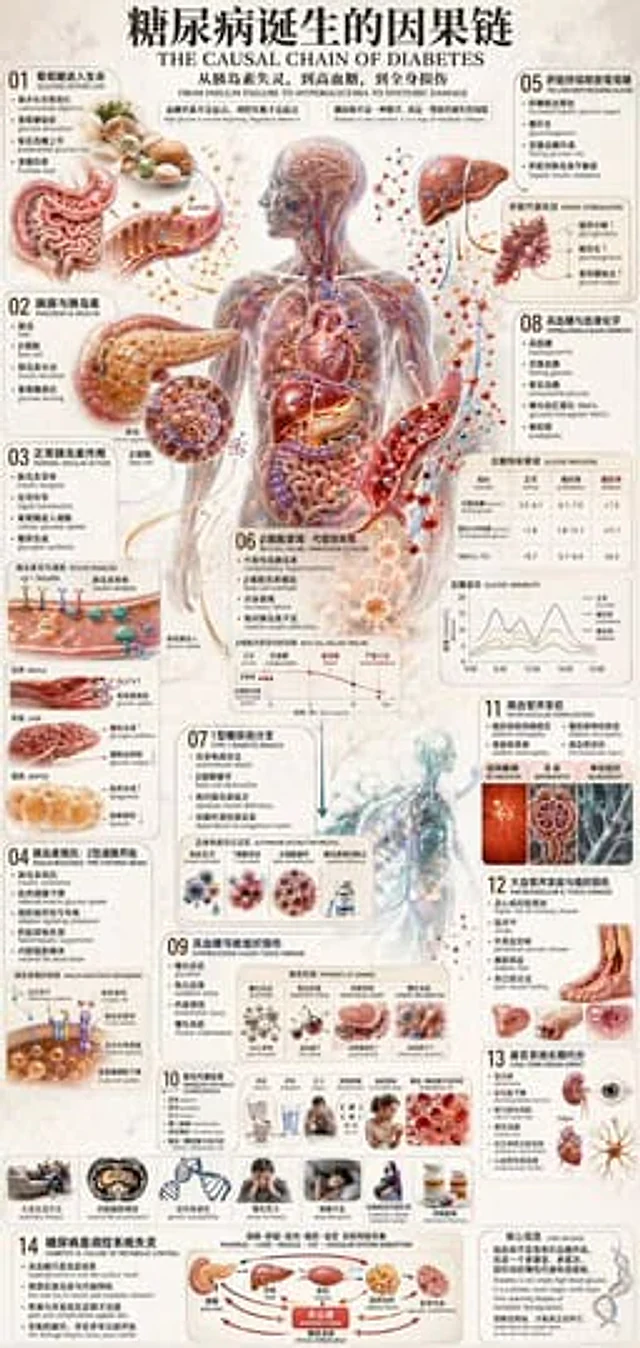
{ "type": "medical infographic poster", "style": "highly detailed anatomical illustrations, clean structured layout, scientific diagrammatic style", "color_palette": "{argument name=\"color palette\" default=\"medical red, blue, beige, and anatomical flesh tones\"}", "lan

信息图可视化设计
GPT Image 2zh

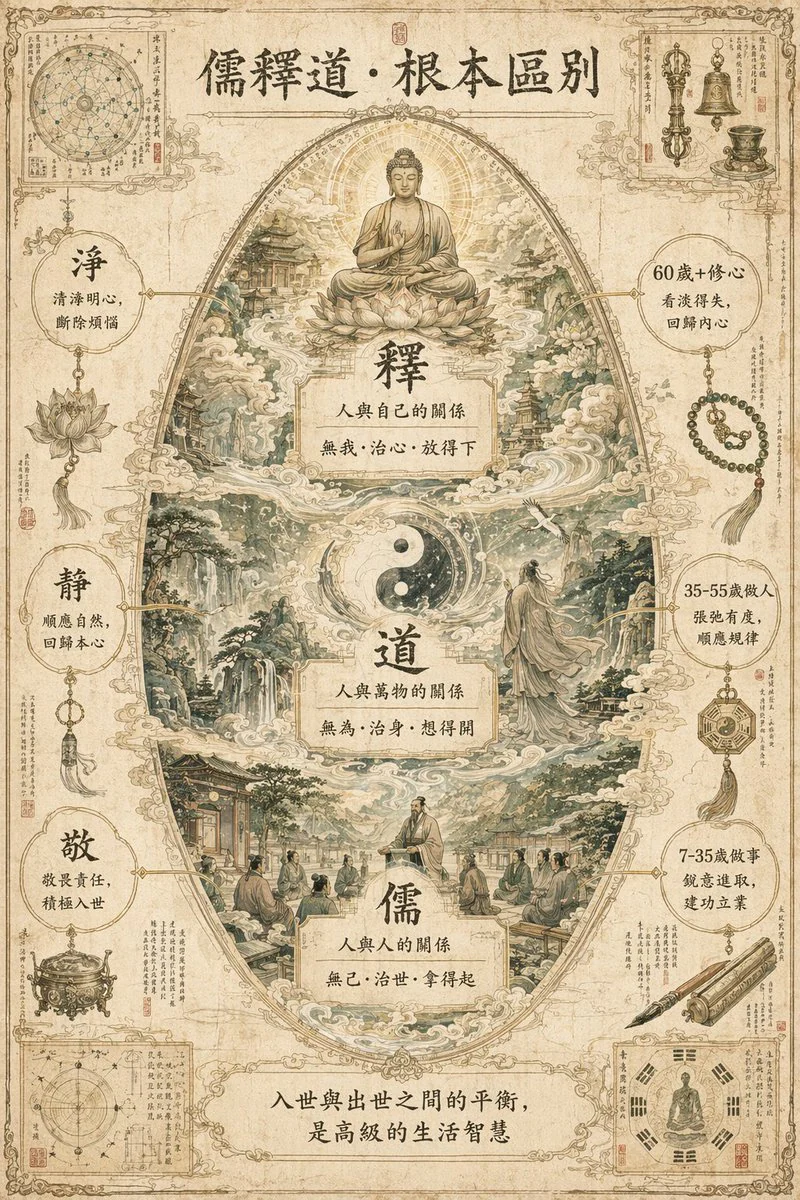
A breathtaking and extremely complex world-building infographic masterpiece conceptualizing the "{argument name="theme" default="Fundamental Differences between Confucianism, Buddhism, and Taoism"}", designed as a profound {argument name="style" default="ancient Oriental mytholog