Document original
GPT Image 2 · en
Scene:
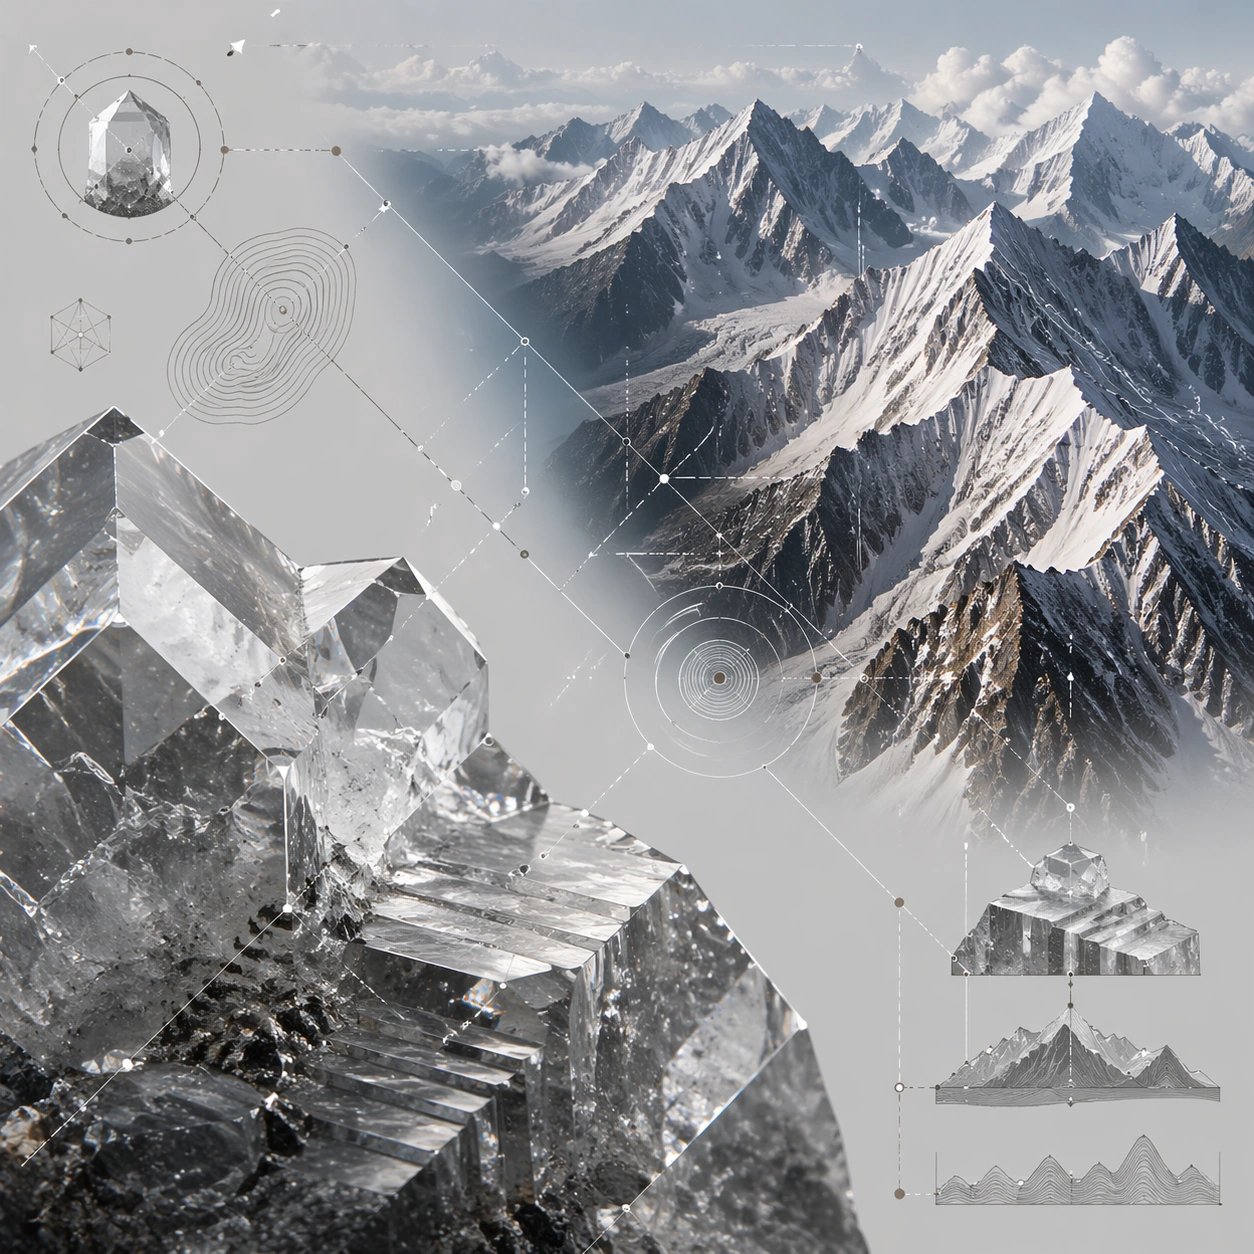
A square premium science infographic with a pale mineral-gray background, crisp studio lighting, and a central mirrored composition. The lower-left quadrant shows a microscopic crystal surface; the upper-right quadrant shows an alpine mountain range. Thin diagonal guides, transparent elevation contours, and small non-readable symbols connect matching ridges and facets across the page.

Subject:
Micro side: a close-up crystal lattice surface with faceted transparent quartz, tiny fractures, growth steps, dust-like inclusions, and accurate refraction. Macro side: a snow-covered mountain range with sharp ridgelines, glacial valleys, rock faces, and atmospheric haze. The shared visual idea is faceted geometry: crystal growth planes echo mountain ridges, fracture lines echo valleys, and light glints repeat across scales.

Important details:
Render both materials convincingly: glassy crystal transparency and cold mountain atmosphere should feel physically distinct. Use matching diagonal rhythm rather than identical shapes. Add a few small cross-section slices and contour-like rings as visual explanation, but no words. The composition should feel like a philosophical science poster: beautiful, clear, and disciplined. Avoid overdecorating with fantasy sparkles or making the mountains look like gemstones.

Use case:
Micro-Macro Infographic single study 6/8, comparing crystal growth facets with mountain range geometry and material light behavior.

Constraints:
No readable text, no watermark, no logos, preserve exact 1:1 aspect ratio, no fake geological labels, no fantasy magic crystals, no impossible floating mountains, no chaotic shards, no glitter overload, no text-heavy poster layout.
Mode d’emploi
- Copiez le prompt original complet, paramètres compris.
- Adaptez le sujet, le texte et la composition à vos besoins.
- Utilisez un outil externe compatible ; vérifiez l’accès et le résultat.
Avant de commencer
- Vérifiez si une image de référence est nécessaire. La compatibilité ne prouve pas le modèle utilisé pour cet exemple.
- Vérifiez noms, chiffres et textes ; les versions du modèle peuvent produire des résultats différents.