Cloud Provider Market Share

Cloud Provider Market Share

Document original

GPT Image 2 · en

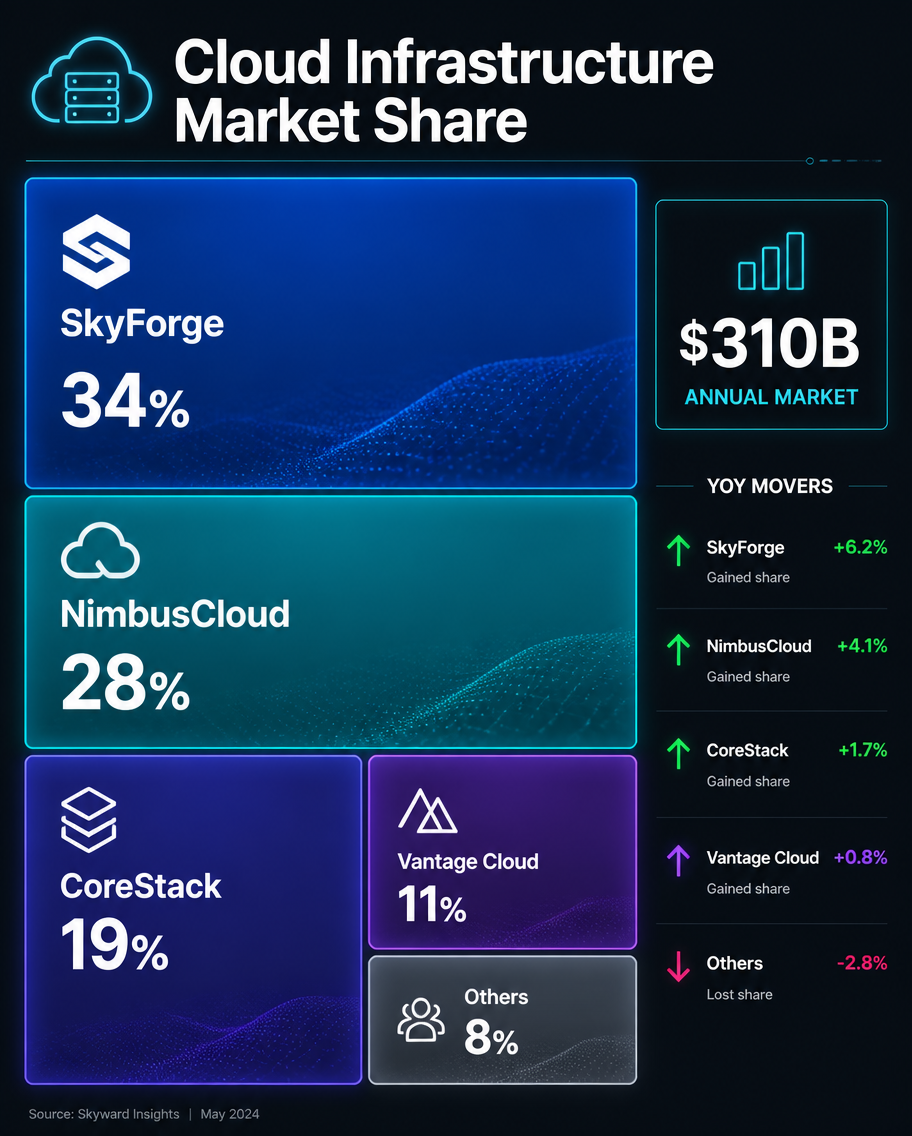
A tech market-share infographic, 4:5, titled 'Cloud Infrastructure Market Share'. A treemap-style block layout sizes invented providers by share: SkyForge 34% (large blue block), NimbusCloud 28% (teal), CoreStack 19% (indigo), Vantage Cloud 11% (purple), Others 8% (grey). Each block shows the name and percentage in white. A small side note '$310B annual market' and a mini arrow list of YoY movers. Dark charcoal background, neon-accent blocks with glowing edges, clean white type, sleek modern tech data-report aesthetic.

Mode d’emploi

  1. Copiez le prompt original complet, paramètres compris.
  2. Adaptez le sujet, le texte et la composition à vos besoins.
  3. Utilisez un outil externe compatible ; vérifiez l’accès et le résultat.

Avant de commencer

  • Vérifiez si une image de référence est nécessaire. La compatibilité ne prouve pas le modèle utilisé pour cet exemple.
  • Vérifiez noms, chiffres et textes ; les versions du modèle peuvent produire des résultats différents.
Exemples similaires

Mobile OS Market Share
GPT Image 2en

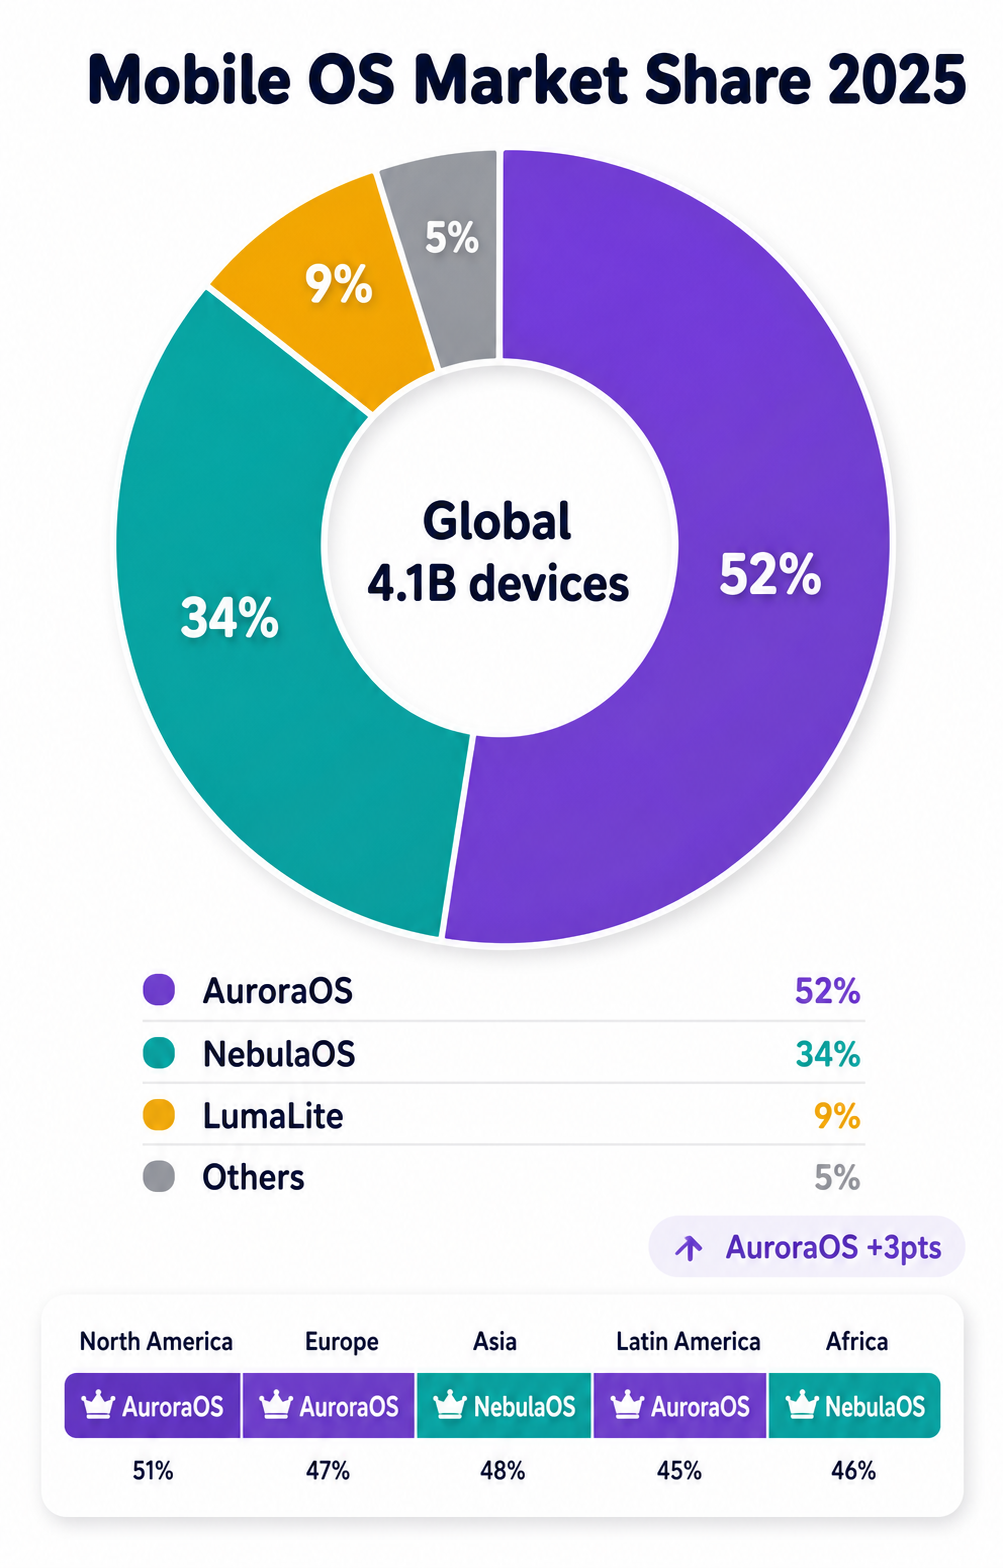
A market-share infographic, 4:5, titled 'Mobile OS Market Share 2025'. A large donut chart splits the market between invented systems: AuroraOS 52% (purple), NebulaOS 34% (teal), LumaLite 9% (amber), Others 5% (grey). The donut center reads 'Global 4.1B devices'. A legend with co

Social Platform Market Share
GPT Image 2en

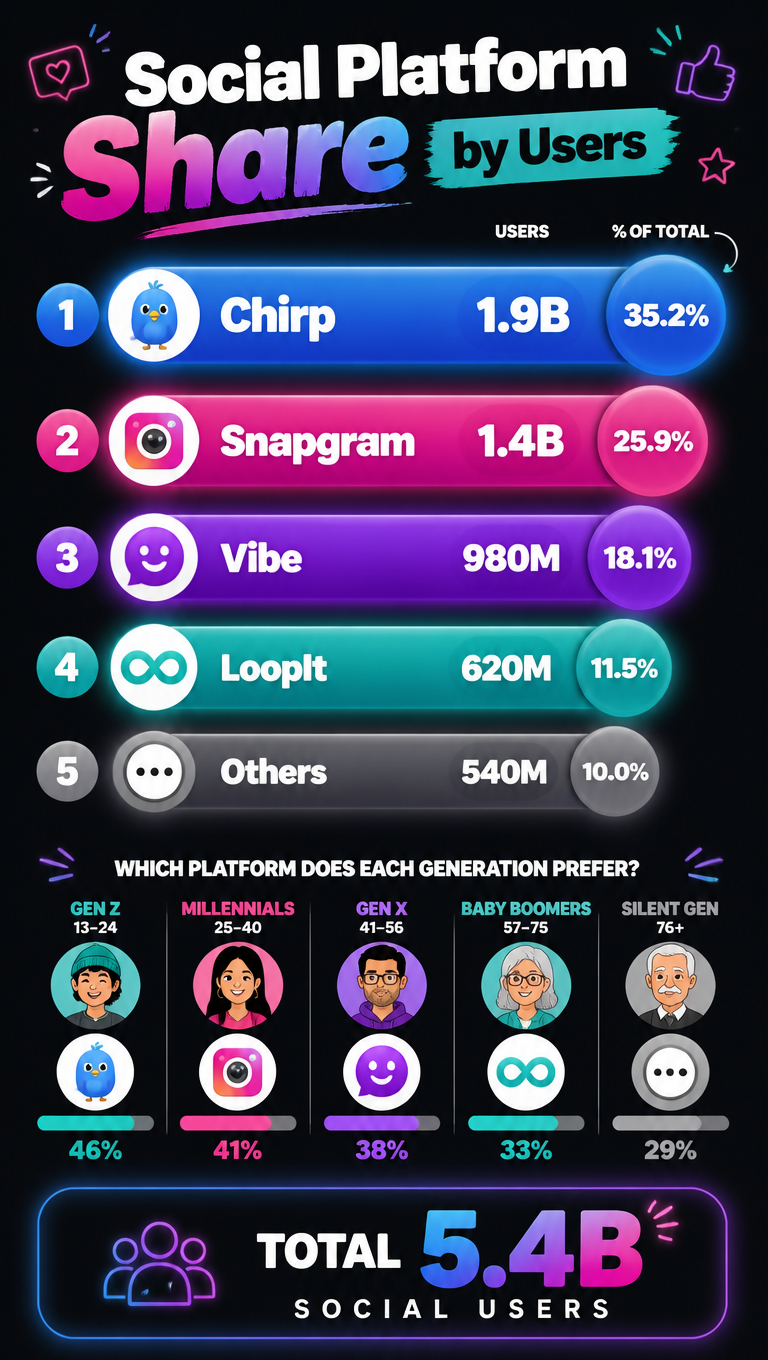
A social-media market-share infographic, 9:16, titled 'Social Platform Share by Users'. A vertical ranked layout: horizontal bubble bars for invented platforms sized by users: Chirp 1.9B (blue), Snapgram 1.4B (magenta), Vibe 980M (purple), LoopIt 620M (teal), Others 540M (grey),

Streaming Platform Share
GPT Image 2en

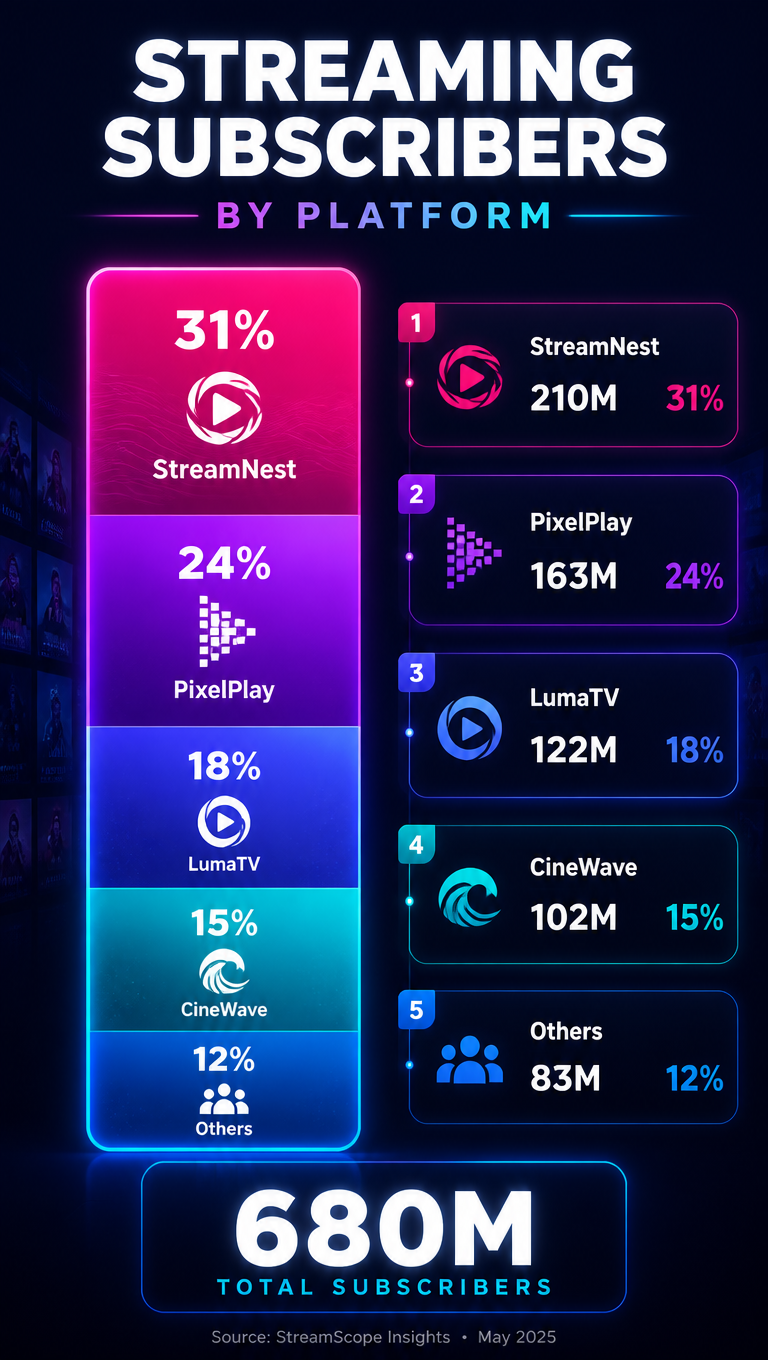
A media market-share infographic, 9:16, titled 'Streaming Subscribers by Platform'. A vertical stacked-column layout where one tall bar splits into invented services: StreamNest 31%, PixelPlay 24%, LumaTV 18%, CineWave 15%, Others 12%, each segment labeled with a percentage and a

Ride-Hailing Market Share
GPT Image 2en

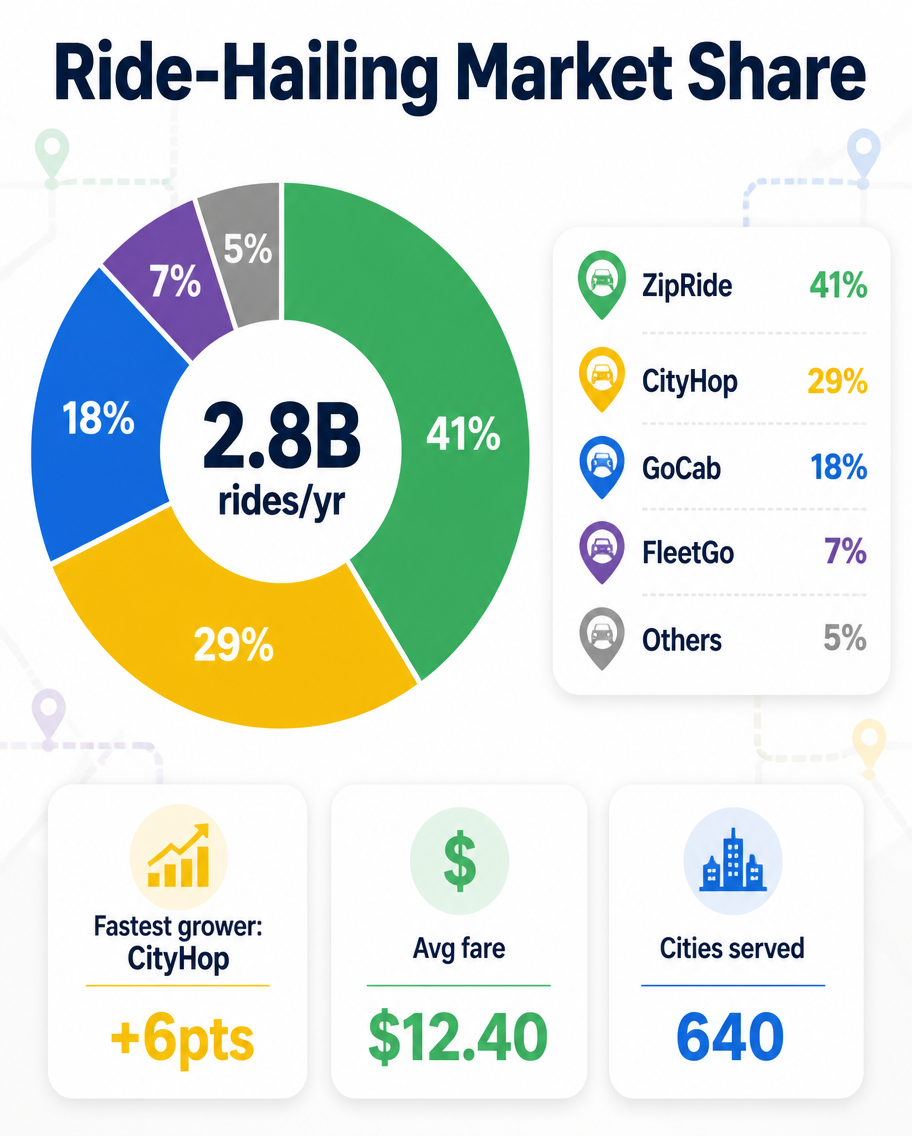
A mobility market-share infographic, 4:5, titled 'Ride-Hailing Market Share'. A donut chart divides invented apps: ZipRide 41% (green), CityHop 29% (yellow), GoCab 18% (blue), FleetGo 7% (purple), Others 5% (grey). Center reads '2.8B rides/yr'. A legend with car-pin color chips a

Coffee Chain Market Share
GPT Image 2en

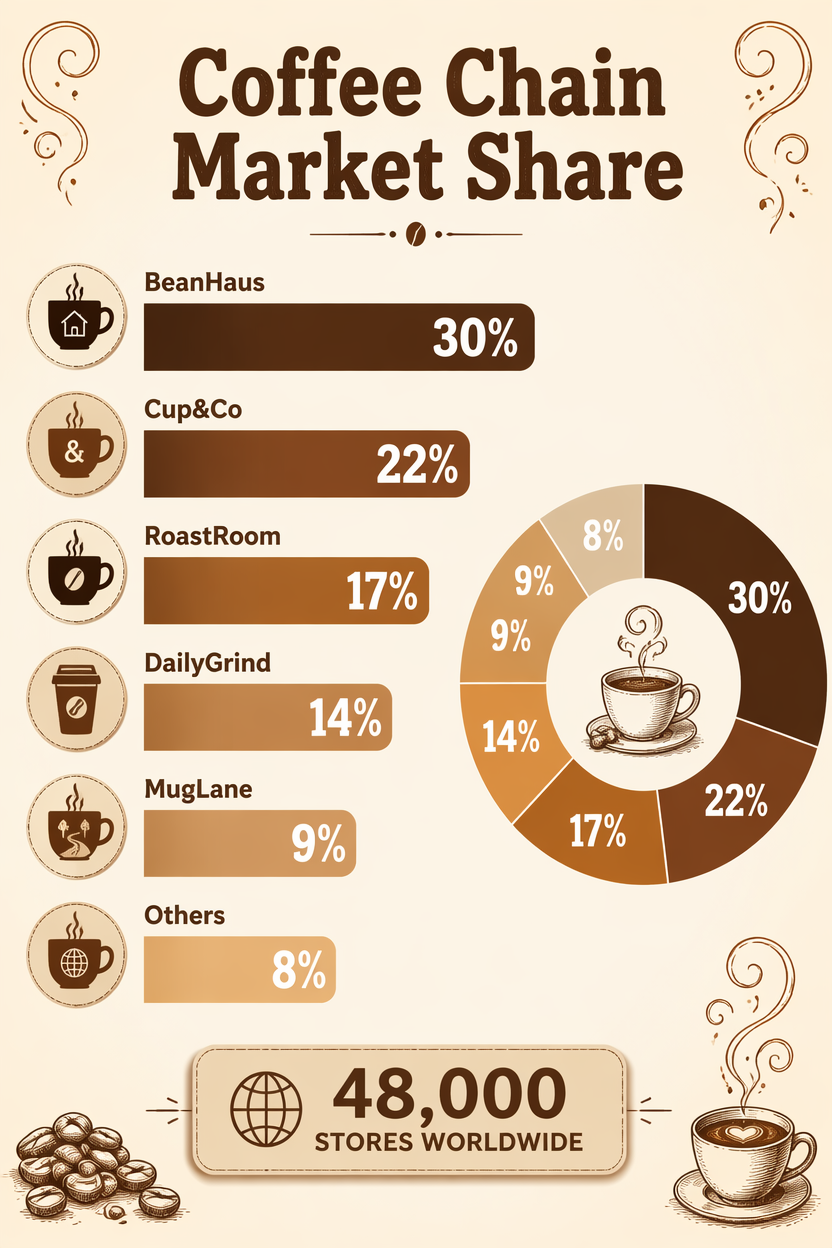
A retail market-share infographic, 2:3, titled 'Coffee Chain Market Share'. A horizontal bar ranking of invented chains: BeanHaus 30%, Cup&Co 22%, RoastRoom 17%, DailyGrind 14%, MugLane 9%, Others 8%, each bar in a warm brown-to-caramel gradient with bold percentages. Small coffe

Gaming Console Share
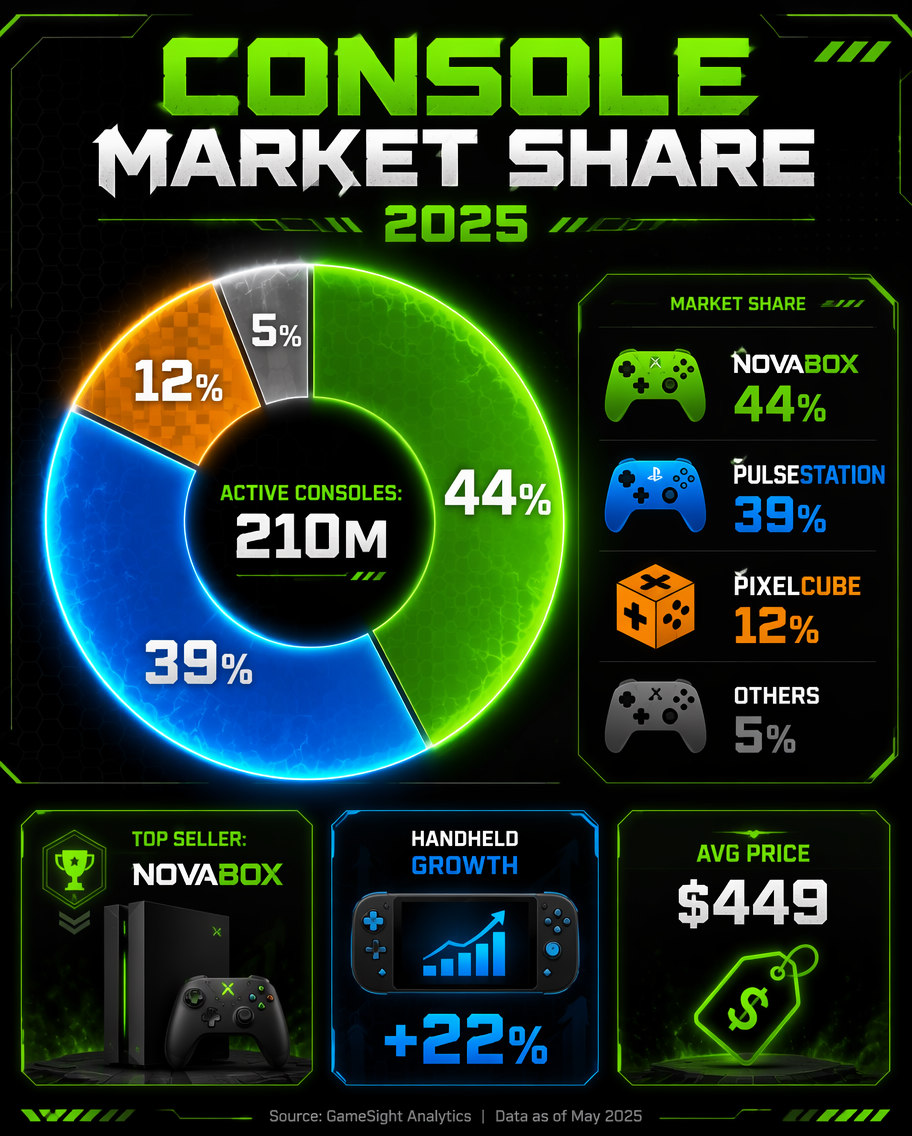
GPT Image 2en

A gaming market-share infographic, 4:5, titled 'Console Market Share 2025'. A donut chart splits invented consoles: NovaBox 44% (green), PulseStation 39% (blue), PixelCube 12% (orange), Others 5% (grey). Center label 'Active consoles: 210M'. A legend with controller-shaped color