Documento originale
GPT Image 2 · en
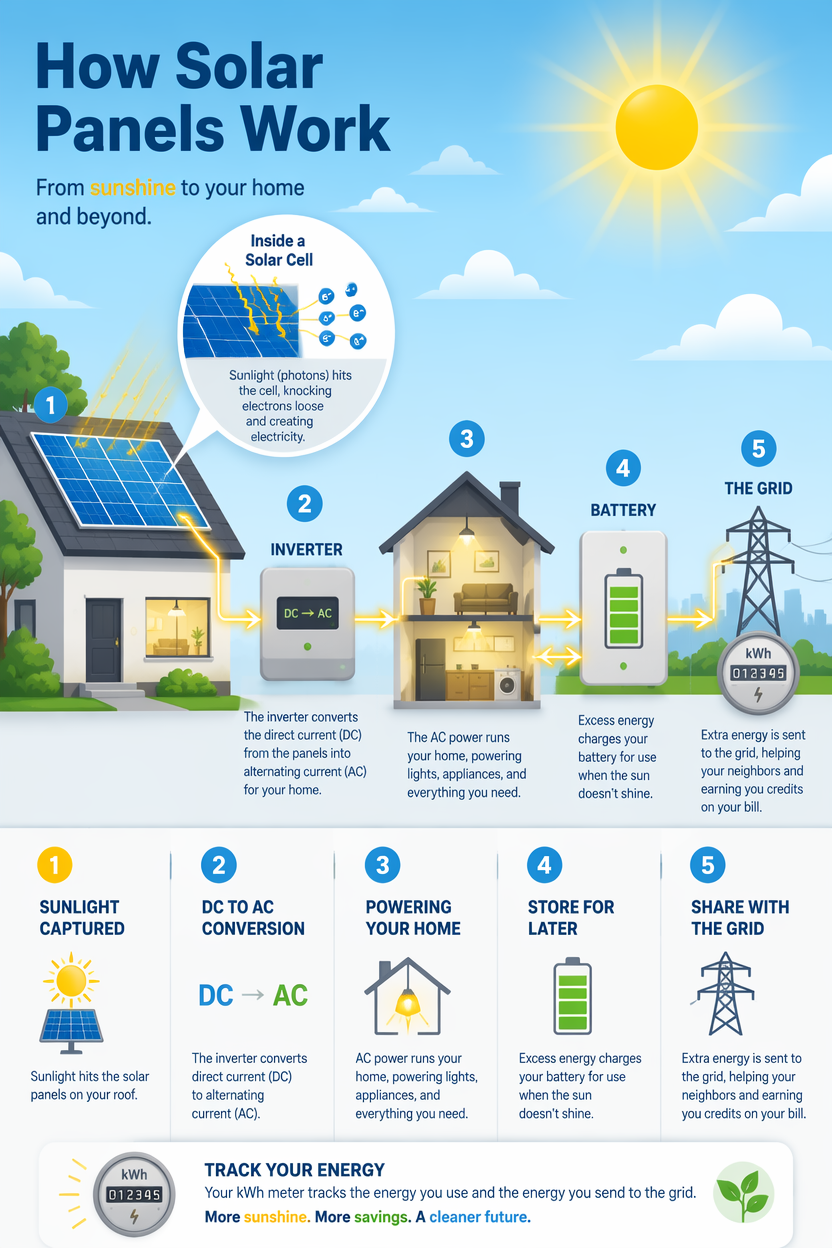
A clean-tech infographic explaining how a solar panel powers a home, drawn as a left-to-right energy flow. Sunlight hits a rooftop panel (a zoomed inset shows photovoltaic cells knocking electrons loose), current runs to an inverter converting DC to AC, then to a house and a battery, with excess feeding the grid. A bright optimistic palette of sky-blue, sunny-yellow and slate, flat vector with soft gradients. Numbered steps 1-5, bold title 'How Solar Panels Work' top-left, a glowing arrow flow, a small kWh meter icon.Come usare
- Copia tutto il prompt originale, inclusi i parametri.
- Adatta soggetto, testo e composizione alle tue esigenze.
- Usa uno strumento esterno compatibile; verifica accesso e risultato.
Prima di iniziare
- Controlla se serve un’immagine di riferimento. La compatibilità non prova il modello usato per l’esempio.
- Verifica nomi, numeri e testi; i risultati cambiano con le versioni del modello.