Documento originale
GPT Image 2 · en
{
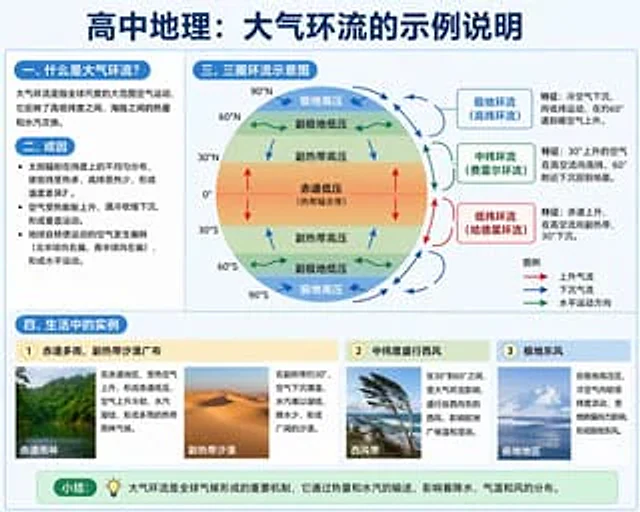
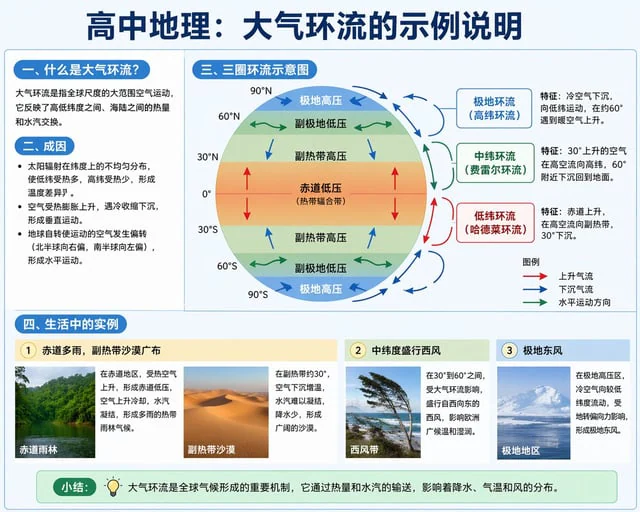
  "type": "educational infographic",
  "style": "clean, modern textbook illustration, light blue and white color palette",
  "header": "{argument name=\"main title\" default=\"高中地理:大气环流的示例说明\"}",
  "layout": {
    "top_left_column": {
      "section_1": {
        "title": "{argument name=\"section one title\" default=\"一、什么是大气环流?\"}",
        "content": "1 short explanatory paragraph about global air movement"
      },
      "section_2": {
        "title": "二、成因",
        "content": "3 bullet points explaining solar radiation, vertical movement, and Coriolis effect"
      }
    },
    "top_right_column": {
      "section_3": {
        "title": "{argument name=\"diagram title\" default=\"三、三圈环流示意图\"}",
        "diagram_features": [
          "Earth cross-section showing latitudes 0 to 90 degrees North and South",
          "Color-coded pressure belts: red (equator), yellow (subtropics), green (subpolar), blue (polar)",
          "Arrows indicating air flow directions"
        ],
        "circulation_cells": {
          "count": 3,
          "labels": ["极地环流 (高纬环流)", "中纬环流 (费雷尔环流)", "低纬环流 (哈德莱环流)"],
          "descriptions": "3 text boxes detailing characteristics of each cell"
        },
        "legend": {
          "title": "图例",
          "items": "3 arrow types: red (ascending), blue (descending), green (horizontal)"
        }
      }
    },
    "bottom_row": {
      "section_4": {
        "title": "{argument name=\"examples title\" default=\"四、生活中的实例\"}",
        "examples": {
          "count": 3,
          "items": [
            {
              "subtitle": "1 赤道多雨,副热带沙漠广布",
              "images": "2 photos: tropical rainforest and desert",
              "text": "2 text blocks explaining the climates"
            },
            {
              "subtitle": "2 中纬度盛行西风",
              "images": "1 photo: windswept trees on a coast",
              "text": "1 text block explaining westerlies"
            },
            {
              "subtitle": "3 极地东风",
              "images": "1 photo: snowy mountains",
              "text": "1 text block explaining polar easterlies"
            }
          ]
        }
      }
    },
    "footer": {
      "label": "{argument name=\"footer label\" default=\"小结:\"}",
      "icon": "lightbulb",
      "content": "1 summary sentence about global climate mechanisms"
    }
  }
}
Come usare
- Copia tutto il prompt originale, inclusi i parametri.
- Adatta soggetto, testo e composizione alle tue esigenze.
- Usa uno strumento esterno compatibile; verifica accesso e risultato.
Prima di iniziare
- Controlla se serve un’immagine di riferimento. La compatibilità non prova il modello usato per l’esempio.
- Verifica nomi, numeri e testi; i risultati cambiano con le versioni del modello.