原文
GPT Image 2 · en
{
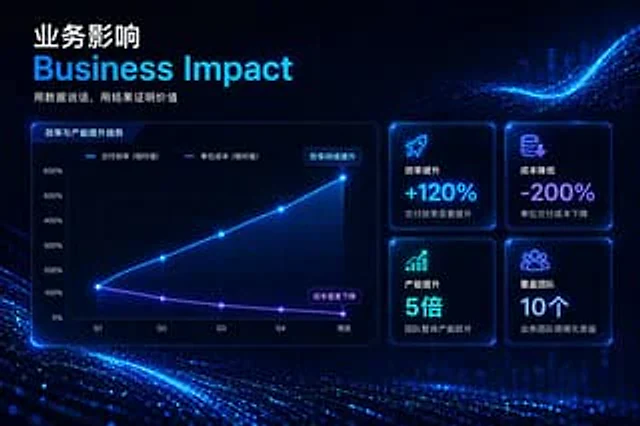
  "type": "Enterprise Presentation Slides",
  "theme": "High-tech, futuristic, dark mode, glowing neon blue and purple accents, abstract digital particle wave background",
  "header": {
    "title_primary": "{argument name=\"main chinese title\" default=\"Business impact\"}",
    "title_secondary": "{argument name=\"main english title\" default=\"Business Impact\"}",
    "tagline": "{argument name=\"tagline\" default=\"Let the data speak for itself, and let the results prove its value.\"}"
  },
  "layout": {
    "left_section": {
      "type": "Line chart",
      "title": "Efficiency and Capacity Improvement Trends",
      "y_axis": [
        "0%",
        "100%",
        "200%",
        "300%",
        "400%",
        "500%",
        "600%"
      ],
      "x_axis": [
        "Q1",
        "Q2",
        "Q3",
        "Q4",
        "Now"
      ],
      "lines": [
        {
          "label": "Delivery efficiency (relative value)",
          "color": "Neon Blue",
          "trend": "Ascending curve",
          "annotation": "Efficiency continues to improve"
        },
        {
          "label": "Unit cost (relative value)",
          "color": "Neon Purple",
          "trend": "Descent Curve",
          "annotation": "Costs decreased significantly"
        }
      ]
    },
    "right_section": {
      "type": "KPI grid",
      "count": 4,
      "arrangement": "2x2 grid",
      "cards": [
        {
          "icon": "Rocket",
          "title": "Efficiency improvement",
          "value": "{argument name=\"kpi 1 value\" default=\"+120%\"}",
          "subtext": "Delivery efficiency significantly improved"
        },
        {
          "icon": "Coin with a downward arrow",
          "title": "Cost reduction",
          "value": "{argument name=\"kpi 2 value\" default=\"-200%\"}",
          "subtext": "Unit delivery cost decreased"
        },
        {
          "icon": "Bar chart with upward arrows",
          "title": "Capacity increase",
          "value": "5 times",
          "subtext": "The team's overall productivity has increased significantly."
        },
        {
          "icon": "crowd",
          "title": "Coverage Team",
          "value": "10",
          "subtext": "Benefits of scaling up business teams"
        }
      ]
    }
  }
}
使い方
- パラメータを含む元のプロンプト全体をコピーします。
- 被写体、文字、構図を自分の要件に置き換えます。
- 対応する外部ツールで使用し、利用条件と結果を確認します。
開始前の確認
- 参考画像の要否を確認してください。互換モデルの表示は、そのモデルでの生成実績を意味しません。
- 名前、数値、画像内の文字を確認します。モデルの版で結果は変わります。