The Software Development Lifecycle

The Software Development Lifecycle

원본 문서

GPT Image 2 · en

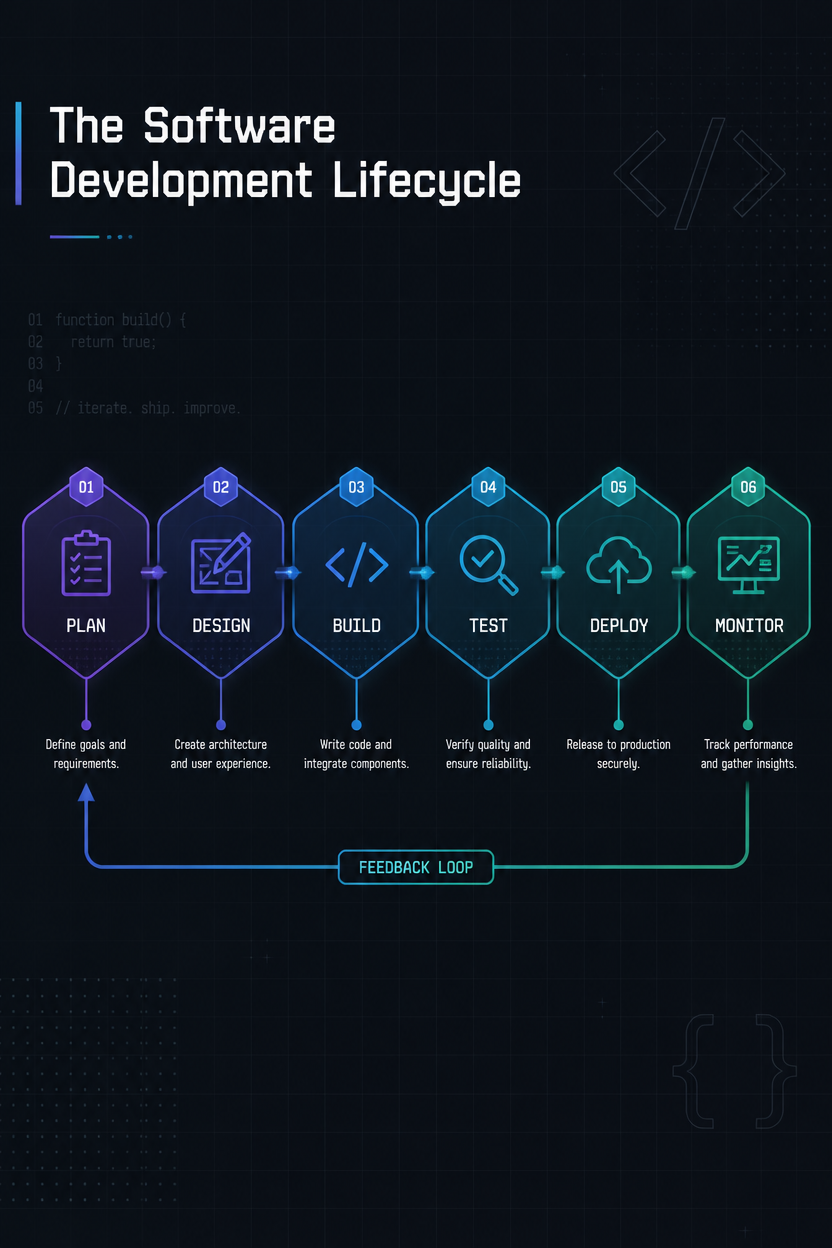
A tech process infographic of the software development lifecycle shown as a horizontal pipeline. Stages - plan, design, build, test, deploy, monitor - appear as connected hexagonal nodes with matching icons and a one-line goal each, plus a feedback arrow looping from monitor back to plan. Modern dark-UI aesthetic, indigo-and-teal gradient nodes on charcoal, monospace labels. Title 'The Software Development Lifecycle' top-left in a clean geometric font, a subtle grid and code-bracket motif in the background.

사용 방법

  1. 매개변수를 포함한 전체 원본 프롬프트를 복사하세요.
  2. 주제, 문구, 구도를 자신의 요구에 맞게 바꾸세요.
  3. 호환되는 외부 도구에서 사용하고 이용 조건과 결과를 확인하세요.

시작 전 확인

  • 참조 이미지가 필요한지 확인하세요. 호환 표시는 해당 모델로 이 예시를 생성했다는 뜻이 아닙니다.
  • 이름, 수치, 이미지 속 문구를 확인하세요. 모델 버전에 따라 결과가 다를 수 있습니다.
비슷한 예시

The Water Cycle
GPT Image 2en

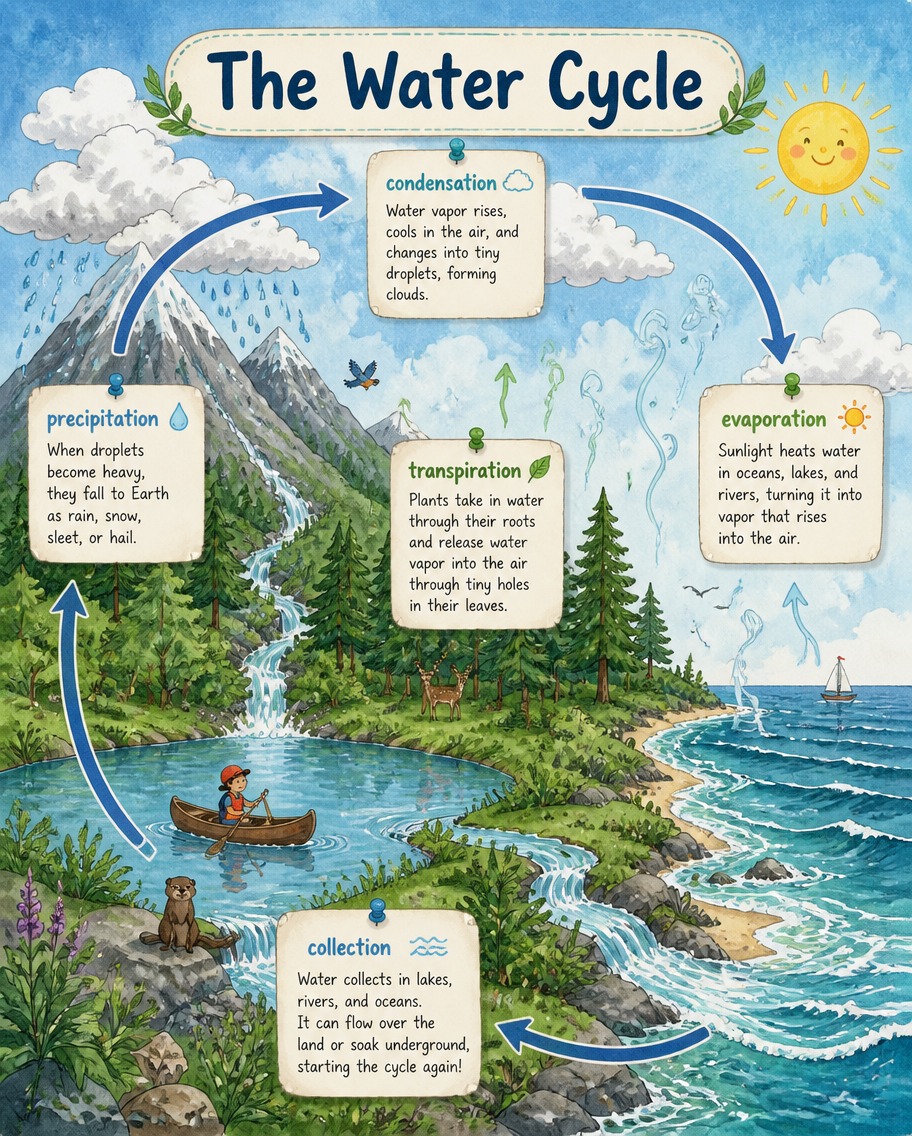
An earth-science infographic of the water cycle drawn as one continuous landscape scene. A mountain, forest, lake and ocean sit under a cloud-filled sky, connected by looping arrows labeled 'evaporation', 'condensation', 'precipitation', 'collection' and 'transpiration'. Tiny sun

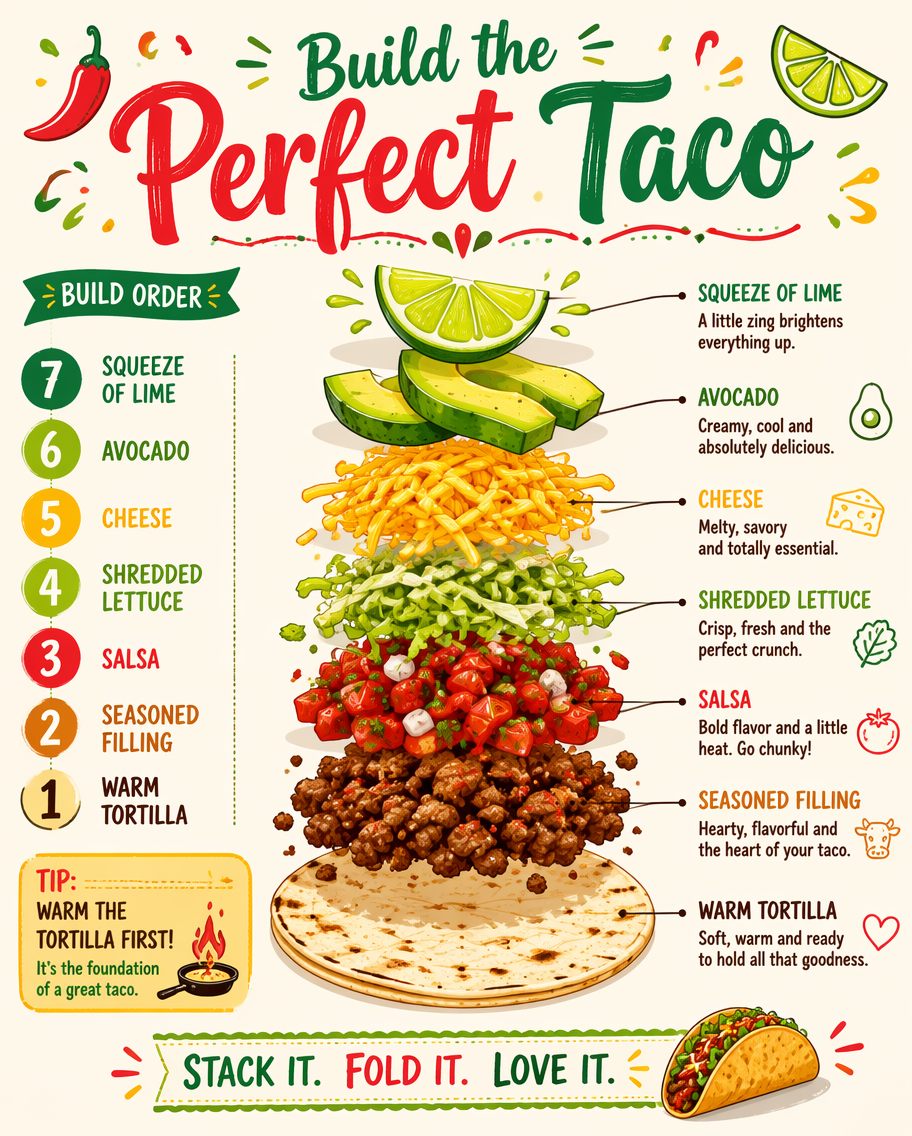
Build the Perfect Taco
GPT Image 2en

A cooking infographic showing how to build the perfect taco, drawn as an exploded stack of labeled layers plus a numbered assembly order. From a warm tortilla up through seasoned filling, salsa, shredded lettuce, cheese, avocado and a squeeze of lime, each layer has a leader line

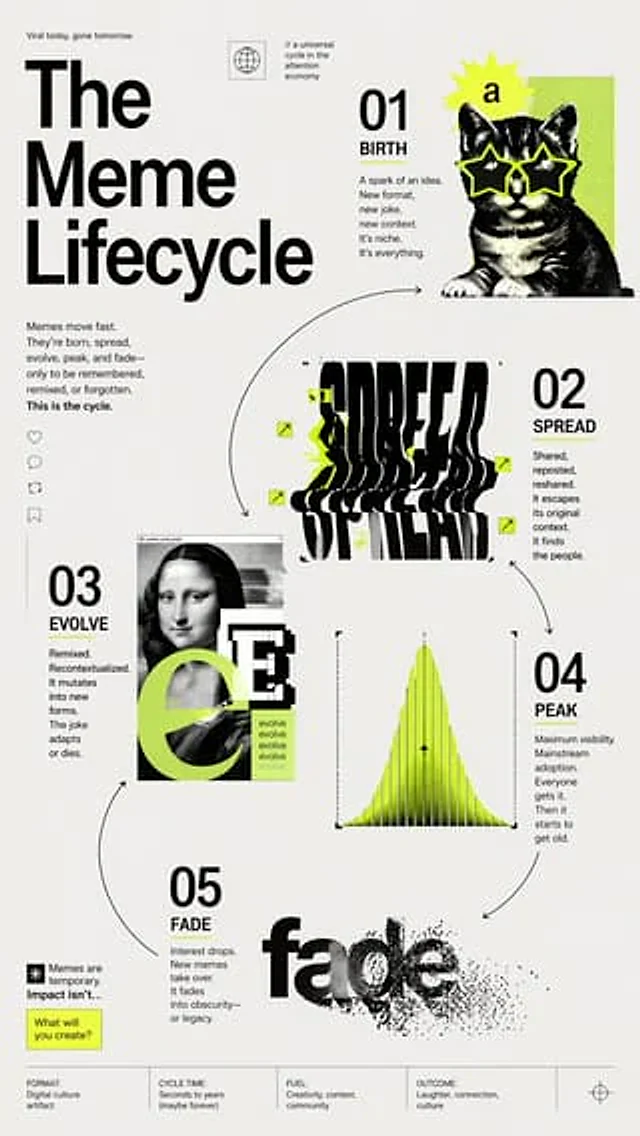
Meme Lifecycle Editorial Infographic
GPT Image 2en

{ "type": "Edit infographic poster", "style": "Swiss modern graphic design, blending Brutalist typography, minimalist grid layout, monochromatic tones accented with lime orange, halftone textures, collage elements, minimal white space, and high-contrast black text on a very l

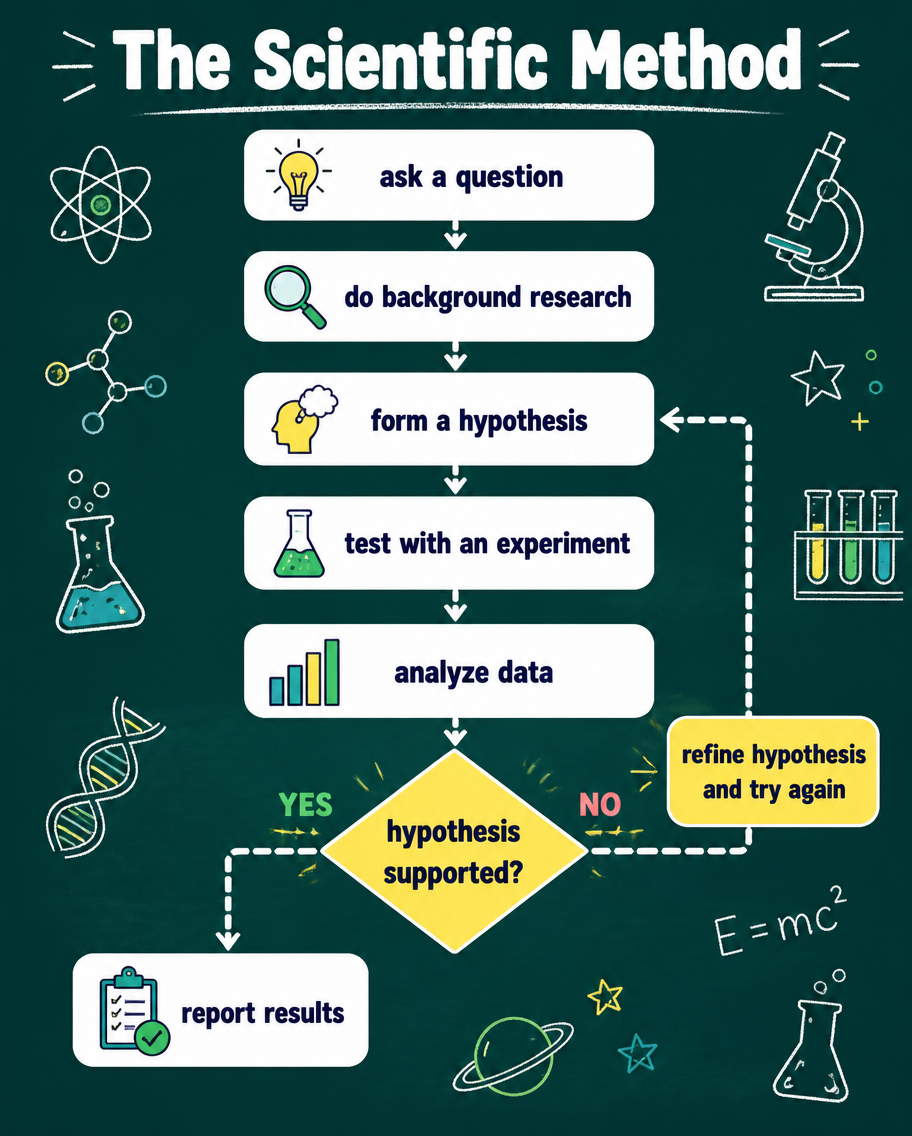
The Scientific Method
GPT Image 2en

An education flowchart infographic of the scientific method drawn as a top-to-bottom decision diagram. Rounded boxes read 'ask a question', 'do background research', 'form a hypothesis', 'test with an experiment', 'analyze data', then a decision diamond 'hypothesis supported?' br

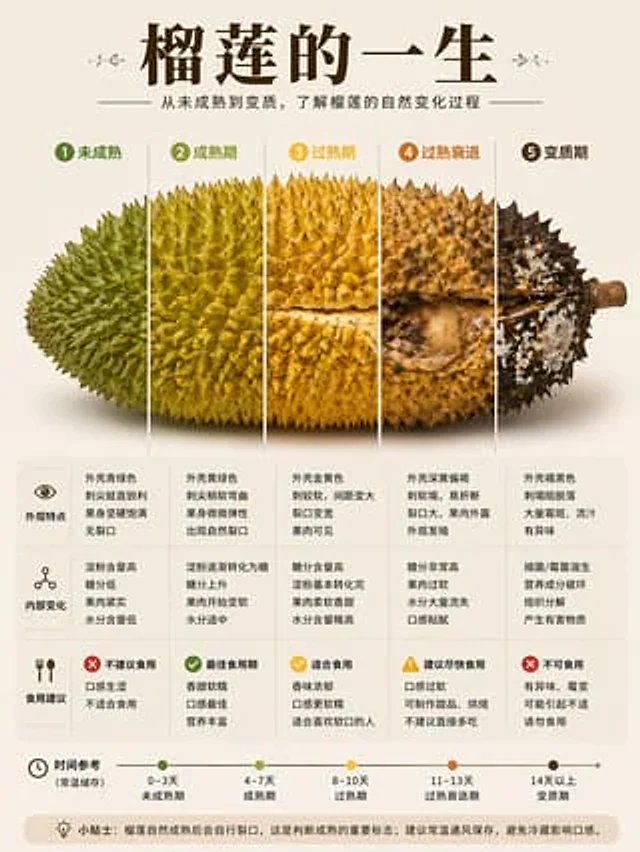
Durian Ripening Lifecycle Infographic
GPT Image 2en

{ "type": "Chinese infographic poster", "topic": "Durian ripening cycle", "style": "Concise, editable food science infographics with high information density, combining realistic fruit cutout photography with a minimalist flat design, warm beige background, and high-quality

Food Lifecycle Infographic Prompt
GPT Image 2en

by"{argument name="food name" default="garlic"} This is a science infographic themed "The Life of a Food Entity." The image must present a single, complete food subject (e.g., a potato, a bunch of bananas, a clove of garlic), showing the changes of the same food at different stag