Documento original
GPT Image 2 · en
{
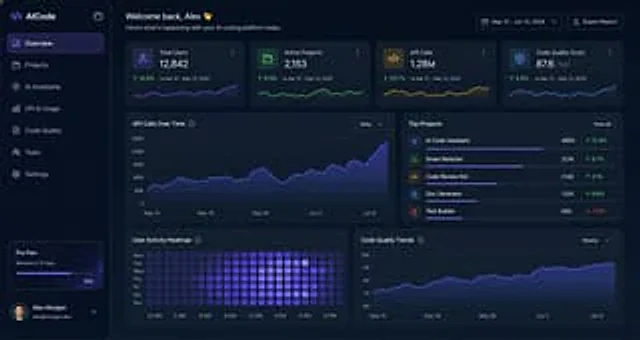
  "type": "Dark SaaS Analytics Dashboard UI",
  "product": {
    "brand": "{argument name=\"brand name\" default=\"AICode\"}",
    "theme": "The interface features a deep navy blue frosted glass texture with subtle gradients, soft lighting, rounded cards, and thin borders, embodying modern developer tool aesthetics."
  },
  "canvas": {
    "aspect_ratio": "16:9",
    "background": "Deep midnight blue, with subtle vignetting and soft radial lighting effects."
  },
  "layout": {
    "structure": "Left sidebar plus main content area",
    "sections": [
      {
        "title": "Sidebar",
        "position": "Left side",
        "count": 8,
        "labels": [
          "AICode",
          "Overview",
          "project",
          "AI Assistants",
          "API and Usage",
          "Code quality",
          "team",
          "set up"
        ],
        "details": "The logo is displayed at the top, and \"Overview\" is highlighted in purple when selected. The subscription card at the bottom shows the Pro Plan, which expires in 12 days. A horizontal progress bar shows 75%. The user profile at the bottom includes an avatar.{argument name=\"user name\" default=\"Alex Morgan\"} and email address alex@morgan.dev"
      },
      {
        "title": "Header",
        "position": "Top Main Area",
        "count": 4,
        "labels": [
          "Welcome back, Alex 👋",
          "This is today's update from your AI programming platform.",
          "May 12, 2024 – June 12, 2024",
          "Export Report"
        ],
        "details": "The left side features a large greeting, while the right side displays a date range selector and an export button."
      },
      {
        "title": "Indicator Card",
        "position": "First line below the header",
        "count": 4,
        "labels": [
          "Total number of users",
          "Active projects",
          "API call volume",
          "Code quality rating"
        ],
        "values": [
          "12,842",
          "2,153",
          "1.28M",
          "876"
        ],
        "details": "Each card includes a small icon, a large main value, and text comparing the period from April 12th to May 12th, 2024, showing positive growth percentages of 14.6%, 8.3%, 23.7%, and 5.9%, respectively. A mini line chart is displayed at the bottom; the colors are purple, green, amber, and blue."
      },
      {
        "title": "Main analysis panel",
        "position": "Middle and bottom rows",
        "count": 4,
        "labels": [
          "API call trends",
          "Popular Projects",
          "User activity heatmap",
          "Code quality trends"
        ],
        "details": "The \"API Call Trends\" chart is a wide area graph with a \"Daily\" dropdown menu; the purple line shows an upward trend, ending near 250K. \"Popular Items\" is a ranking list of 5 items, with progress bars and percentage changes. The \"User Activity Heatmap\" is a 7-row weekly heatmap with hourly labels from 12 PM to 9 PM. The \"Code Quality Trends\" chart is a line graph with a \"Weekly\" dropdown menu; the purple curve rises smoothly, from approximately 70 to just over 90."
      },
      {
        "title": "Popular Projects List",
        "position": "Middle right panel",
        "count": 5,
        "labels": [
          "AI Code Assistant",
          "Smart Refactor",
          "Code Review Bot",
          "Doc Generator",
          "Test Builder"
        ],
        "values": [
          "485K",
          "321K",
          "214K",
          "132K",
          "98K"
        ],
        "details": "The first four items showed positive growth in green, at 12.4%, 8.7%, 3.1%, and 6.8% respectively, while Test Builder showed negative growth in red, at -1.2%; each row had a colored square icon and a thin horizontal progress bar."
      }
    ]
  },
  "style": {
    "visual_language": "High-end financial technology and AI product design prototype",
    "rendering": "A clear, high-fidelity UI prototype, subtle shadows, neon edge lighting effects, exquisite charts, and a clean sans-serif font.",
    "primary_accent": "{argument name=\"accent color\" default=\"Electric Violet\"}",
    "secondary_accents": [
      "Emerald Green",
      "Amber Yellow",
      "Cyan"
    ],
    "density": "Information-rich and spatially balanced, with a well-balanced grid and high readability."
  }
}
Como usar
- Copie o prompt original completo, incluindo os parâmetros.
- Adapte o tema, o texto e a composição aos seus requisitos.
- Use uma ferramenta externa compatível; confira o acesso e o resultado.
Antes de começar
- Verifique se é necessária uma imagem de referência. Compatibilidade não comprova qual modelo gerou o exemplo.
- Confira nomes, números e textos; os resultados variam entre versões do modelo.