
Documento original
GPT Image 2 · en
Scene:
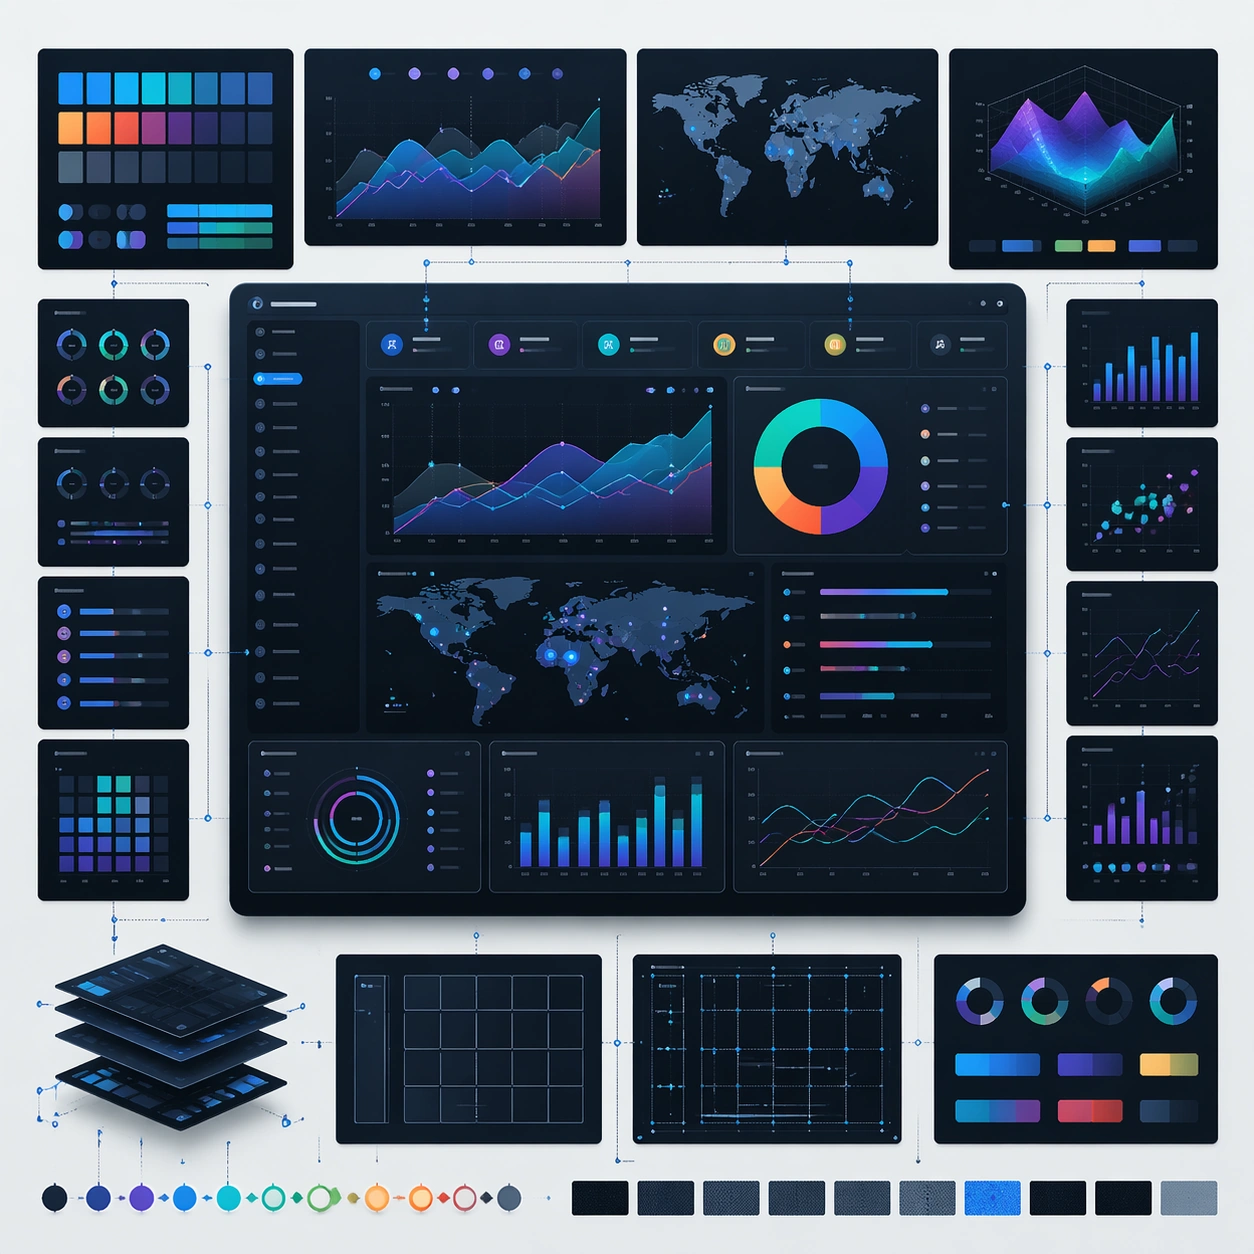
A square plate or board viewed straight-on, with crisp organization, disciplined spacing, and premium print clarity. Build the frame around a polished final technical plate that feels ready for a research deck or exhibition wall. Keep the lighting, camera distance, and spatial organization tuned for a high-signal research image rather than a casual snapshot. The image belongs to the Dashboard Data Visualization theme and should feel immediately legible as a prompt atlas theme for dashboard data visualization, testing structured-layout, technical-diagram, reasoning-composition with gpt image 2..

Subject:
Center the study on a polished final technical plate that feels ready for a research deck or exhibition wall. Translate the theme into a concrete visual statement instead of an abstract mood board: the viewer should understand what kind of image this is, what is being tested, and why the composition is difficult. Use the slug idea of dashboard data visualization as a literal guide for subject matter, materials, and staging. If helpful, borrow the broad visual cues suggested by CO2, UI, but keep the result original and specific to this study.

Important details:
The image should communicate logic through grouping, hierarchy, callouts, insets, and believable professional layout discipline rather than decorative noise. Preserve a disciplined square composition, clear focal hierarchy, and enough secondary information to make the image feel complete rather than underspecified. The image should look polished, novel, and exhibition-ready, with topic-specific credibility coming from the way surfaces, structure, and visual language reinforce Dashboard Data Visualization. Avoid generic filler elements that do not serve the main concept.

Use case:
Dashboard Data Visualization single study 8/8, testing structured-layout, technical-diagram, reasoning-composition through the final plate variation.

Constraints:
No readable text, no watermark, no logos, preserve exact 1:1 aspect ratio, no readable labels, no messy arrows, no random infographic decoration, no fake UI chrome unless the topic calls for it, no broken alignment, no meaningless clutter.
Como usar
- Copie o prompt original completo, incluindo os parâmetros.
- Adapte o tema, o texto e a composição aos seus requisitos.
- Use uma ferramenta externa compatível; confira o acesso e o resultado.
Antes de começar
- Verifique se é necessária uma imagem de referência. Compatibilidade não comprova qual modelo gerou o exemplo.
- Confira nomes, números e textos; os resultados variam entre versões do modelo.