原始文档
GPT Image 2 · en
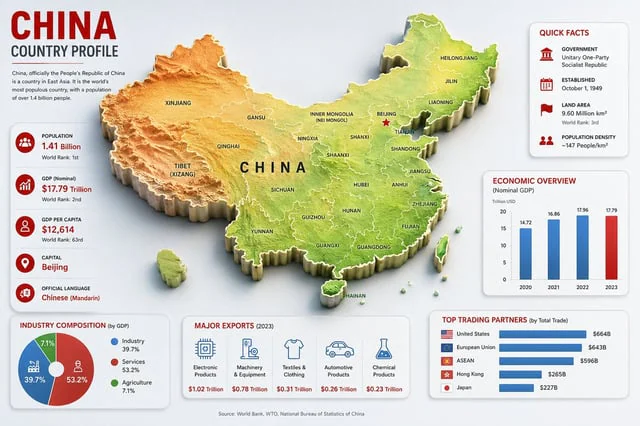
Goal: Create a clean, modern country-profile infographic for {argument name="country name" default="China"}, titled “CHINA COUNTRY PROFILE,” with a large central 3D raised relief map and surrounding statistical cards.

Canvas: 16:9 horizontal infographic, light gray background, crisp corporate editorial style, subtle shadows, red/blue/green accent colors, high-resolution vector-meets-3D look.

Main map: Place a large raised 3D topographic map of China in the center, occupying most of the canvas. Use terrain coloring: orange-brown mountains in the west, yellow central plateau, green eastern lowlands and coast. Add white province borders and black province labels. Include Taiwan, Hainan, and small South China Sea islands as separate raised pieces. Put large spaced black letters “CHINA” across the center. Mark Beijing with a red star and label it. Visible map labels should include exactly 28 province/region/city labels: Xinjiang, Tibet (Xizang), Qinghai, Gansu, Inner Mongolia (Nei Mongol), Ningxia, Sichuan, Yunnan, Guizhou, Guangxi, Guangdong, Hainan, Fujian, Zhejiang, Jiangsu, Anhui, Shandong, Hubei, Hunan, Shaanxi, Shanxi, Beijing, Tianjin, Liaoning, Jilin, Heilongjiang, Taiwan, and China.

Top-left title block: Big red headline “CHINA,” dark subtitle “COUNTRY PROFILE,” a thin red divider line, and a short paragraph: “China, officially the People’s Republic of China is a country in East Asia. It is the world’s most populous country, with a population of over 1.4 billion people.”

Left statistics card: A tall rounded white card with exactly 5 stacked fact rows, each with a red circular icon and text. The 5 rows are: Population — {argument name="population value" default="1.41 Billion"} — World Rank: 1st; GDP (Nominal) — $17.79 Trillion — World Rank: 2nd; GDP Per Capita — $12,614 — World Rank: 63rd; Capital — {argument name="capital city" default="Beijing"}; Official Language — {argument name="official language" default="Chinese (Mandarin)"}. Use thin separators between rows.

Top-right quick facts card: A rounded white card titled “QUICK FACTS” in red. Include exactly 4 rows with red icons: Government — Unitary One-Party Socialist Republic; Established — October 1, 1949; Land Area — 9.60 Million km², World Rank: 3rd; Population Density — ~147 People/km².

Middle-right economic chart card: A rounded white card titled “ECONOMIC OVERVIEW” with subtitle “(Nominal GDP)” and small label “Trillion USD.” Include exactly 4 vertical bars for 2020, 2021, 2022, 2023 with values 14.72, 16.86, 17.96, 17.79. Use blue bars for 2020–2022 and a red bar for 2023.

Bottom-left industry card: A rounded white card titled “INDUSTRY COMPOSITION (by GDP).” Include exactly 3-part donut chart segments: Industry 39.7% in blue, Services 53.2% in red, Agriculture 7.1% in green. Add matching legend with the same 3 labels and percentages.

Bottom-center exports card: A rounded white card titled “MAJOR EXPORTS (2023).” Include exactly 5 export columns with blue line icons and red values: Electronic Products — $1.02 Trillion; Machinery & Equipment — $0.78 Trillion; Textiles & Clothing — $0.31 Trillion; Automotive Products — $0.26 Trillion; Chemical Products — $0.23 Trillion.

Bottom-right trading partners card: A rounded white card titled “TOP TRADING PARTNERS (by Total Trade).” Include exactly 5 horizontal blue bars with small flag icons and values: United States — $664B; European Union — $643B; ASEAN — $596B; Hong Kong — $265B; Japan — $227B.

Footer: Center a small source line reading “Source: World Bank, WTO, National Bureau of Statistics of China.”

Constraints: Keep all cards aligned around the map without overlapping it, use consistent typography, red headings, blue chart elements, subtle drop shadows, rounded card corners, and no watermark.
使用方法
- 复制完整原始提示词,并保留其中的参数。
- 按需求替换主体、文字和构图要求。
- 在兼容的外部工具中使用,核对当前使用条件并检查结果。
开始前需了解
- 先确认是否需要参考图。标注兼容模型,不代表该示例由这个模型生成。
- 核对名称、数字与画面文字;不同模型版本的结果可能不同。