Documento original
GPT Image 2 · en
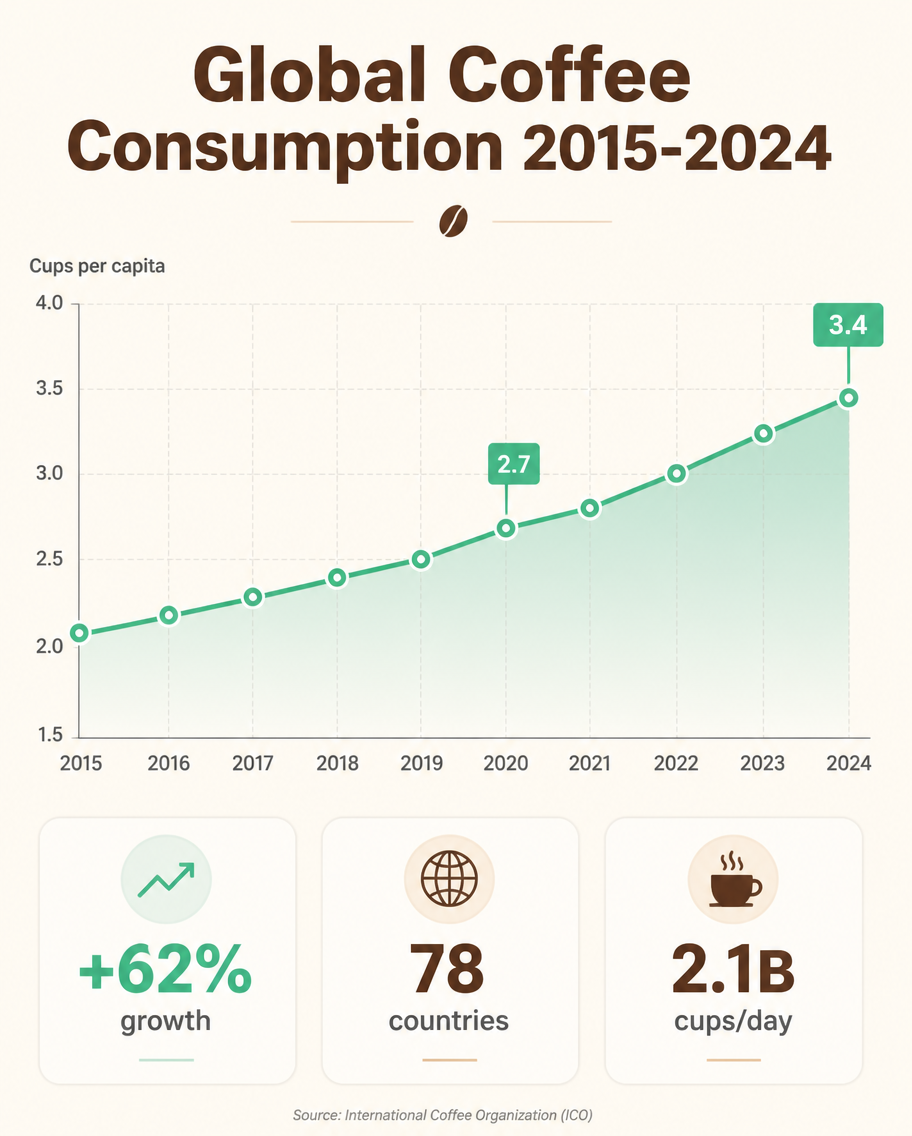
A clean flat-design infographic titled 'Global Coffee Consumption 2015-2024', 4:5 portrait. A single hero line chart fills the upper two-thirds, plotting cups per capita rising from 2.1 to 3.4 over ten years with a smooth mint-green line, soft gradient fill beneath, and circular data markers labeled at 2020 (2.7) and 2024 (3.4). Thin grey axis grid, sans-serif labels. Three stat chips below read '+62% growth', '78 countries', '2.1B cups/day'. Warm cream background, coffee-brown headline, generous white space, modern editorial style.Cómo usar
- Copia el prompt original completo, incluidos los parámetros.
- Adapta el tema, el texto y la composición a tus necesidades.
- Usa una herramienta externa compatible; comprueba el acceso y el resultado.
Antes de empezar
- Comprueba si necesita una imagen de referencia. La compatibilidad no demuestra qué modelo generó el ejemplo.
- Revisa nombres, cifras y textos; el resultado puede variar entre versiones del modelo.