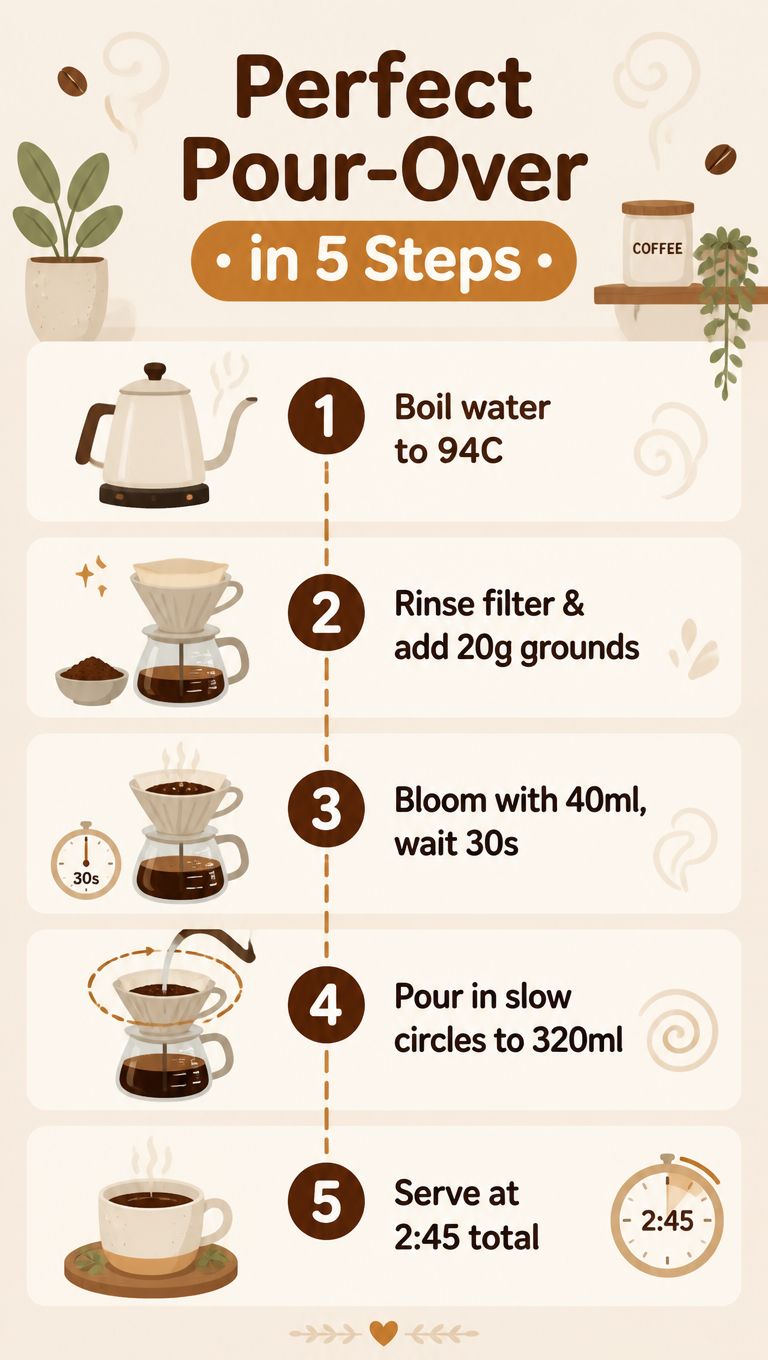
Design illustration · Global Coffee Consumption Trend — API Models · CC BY 4.0

Design illustration · Global Coffee Consumption Trend — API Models · CC BY 4.0

Original document

GPT Image 2 · en

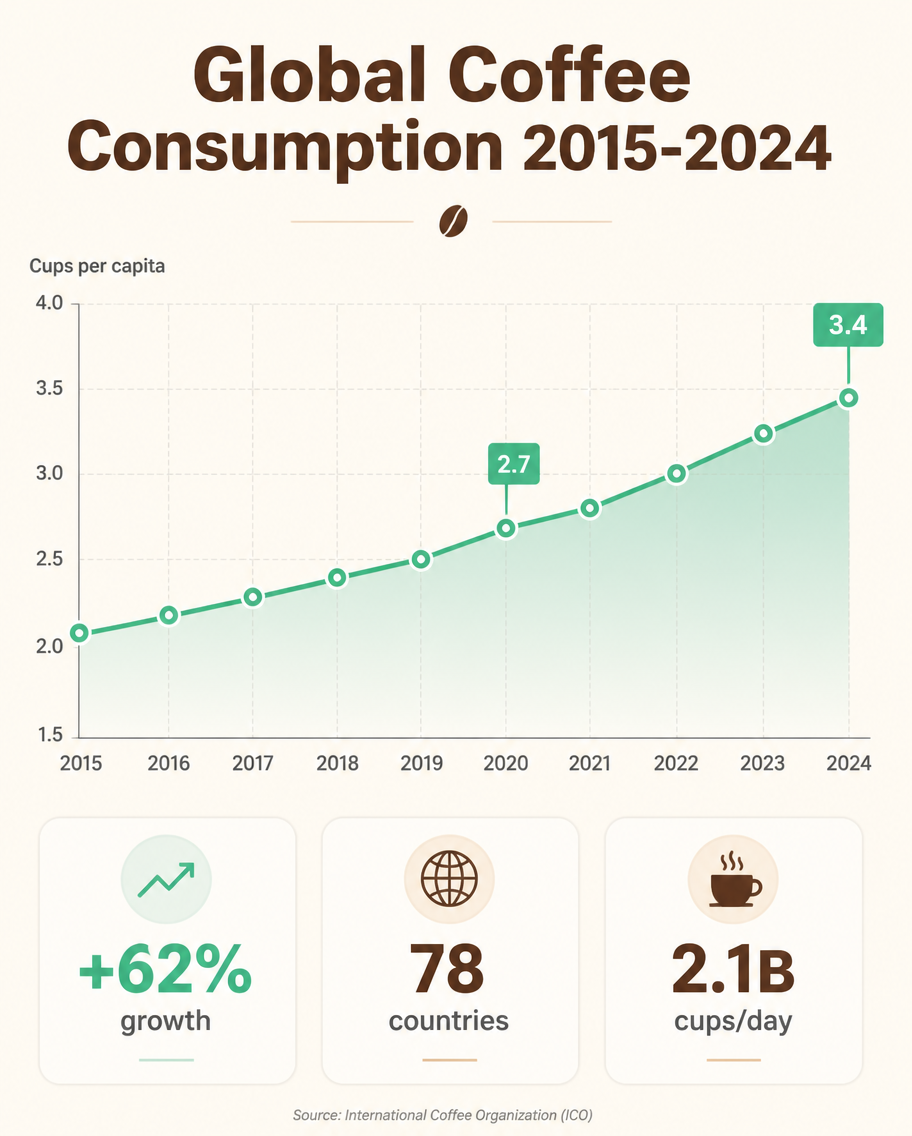
A clean flat-design infographic titled 'Global Coffee Consumption 2015-2024', 4:5 portrait. A single hero line chart fills the upper two-thirds, plotting cups per capita rising from 2.1 to 3.4 over ten years with a smooth mint-green line, soft gradient fill beneath, and circular data markers labeled at 2020 (2.7) and 2024 (3.4). Thin grey axis grid, sans-serif labels. Three stat chips below read '+62% growth', '78 countries', '2.1B cups/day'. Warm cream background, coffee-brown headline, generous white space, modern editorial style.

How to use

  1. Copy the complete original prompt, including any parameters.
  2. Replace the subject, text and composition with your own requirements.
  3. Use a compatible external tool; check its current access conditions and review the result.

Before you start

  • Check whether a reference image is required. A compatible model label does not mean this example was generated with that model.
  • Keep names, figures and visible text accurate; results can vary between model versions.
More like this

Coffee Chain Market Share
GPT Image 2en

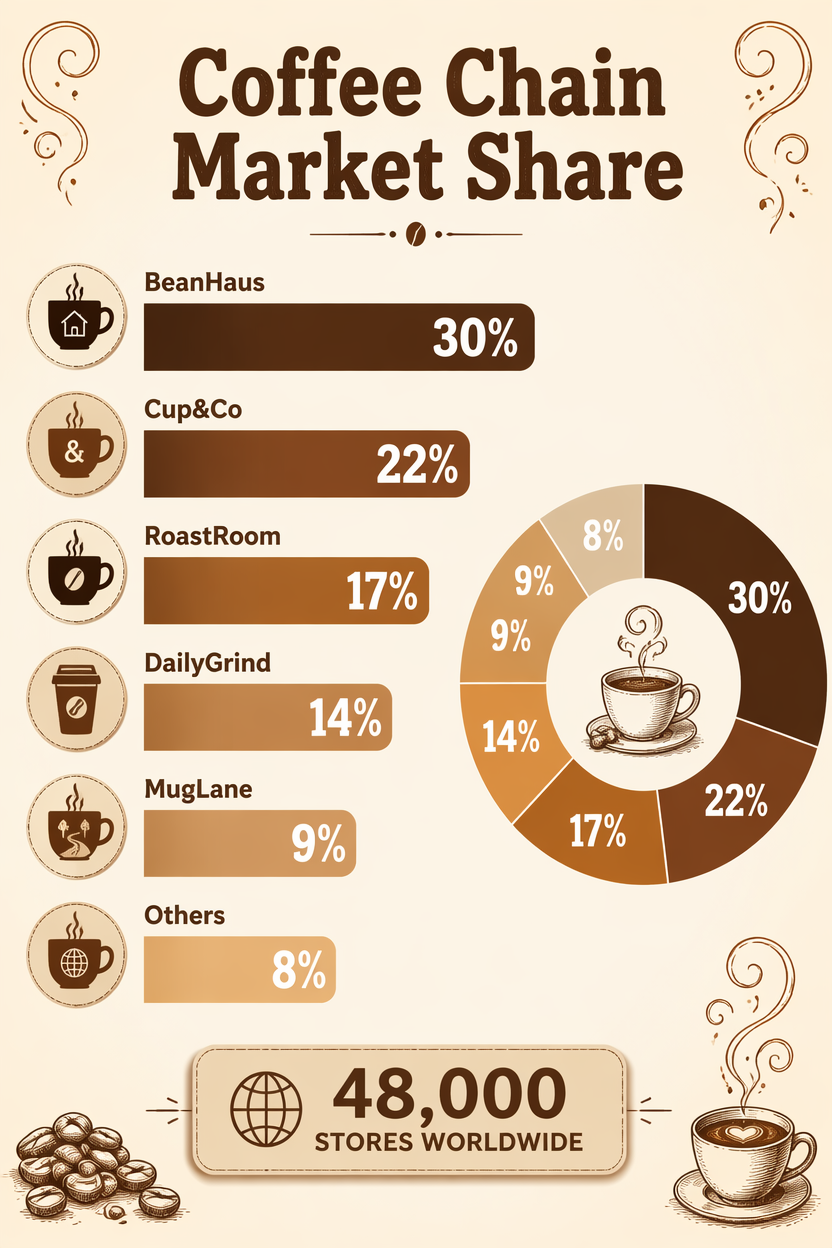
A retail market-share infographic, 2:3, titled 'Coffee Chain Market Share'. A horizontal bar ranking of invented chains: BeanHaus 30%, Cup&Co 22%, RoastRoom 17%, DailyGrind 14%, MugLane 9%, Others 8%, each bar in a warm brown-to-caramel gradient with bold percentages. Small coffe

Coffee Brewing Ratio Wall Chart
GPT Image 2en

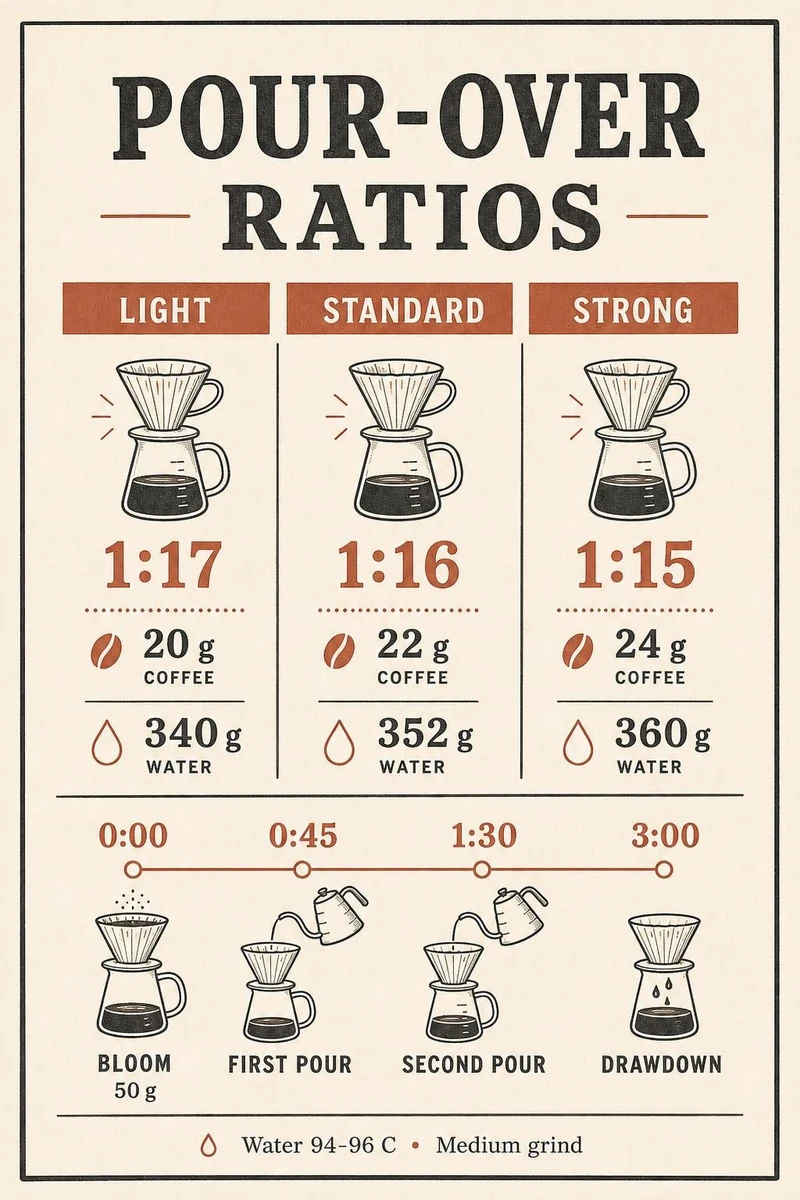
A printed kitchen wall chart titled "POUR-OVER RATIOS" in bold slab serif, on warm off-white paper with a thin charcoal border. Three labelled columns compare brew strengths: LIGHT (1:17, 20 g coffee, 340 g water), STANDARD (1:16, 22 g coffee, 352 g water), STRONG (1:15, 24 g cof

Pour-Over Coffee Guide
Seedream 4.5en

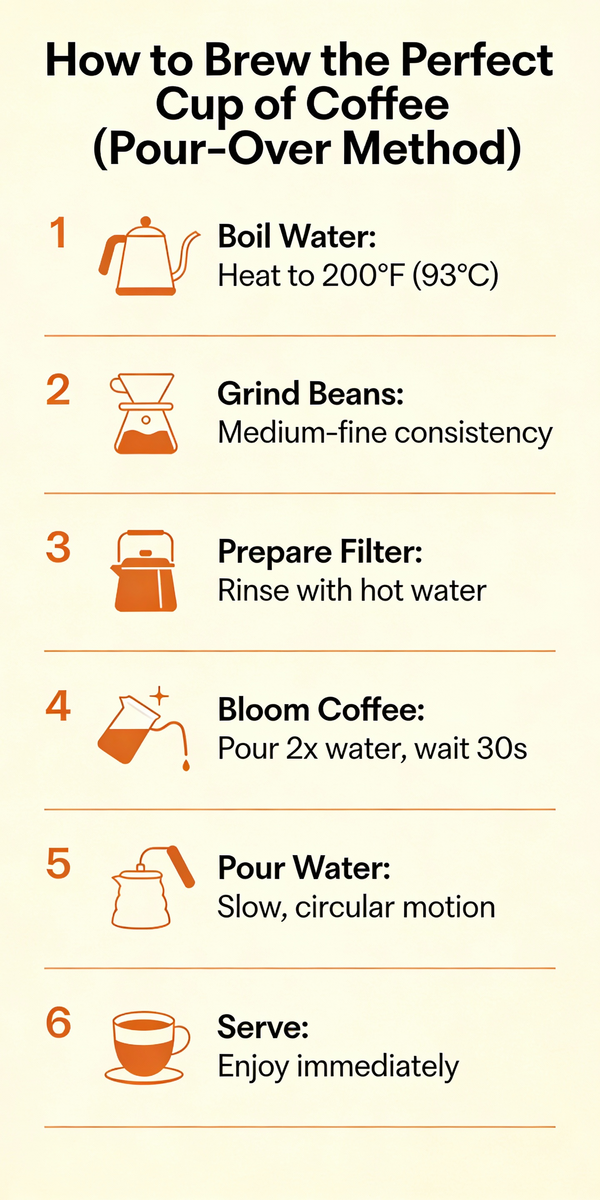
A simple, step-by-step visual guide on “How to Brew the Perfect Cup of Coffee using a Pour-Over Method.” The infographic should have 6–8 steps, each with a clean icon and a short, clear instruction (e.g., “1. Boil Water,” “2. Grind Beans”). The style should be minimalist and icon

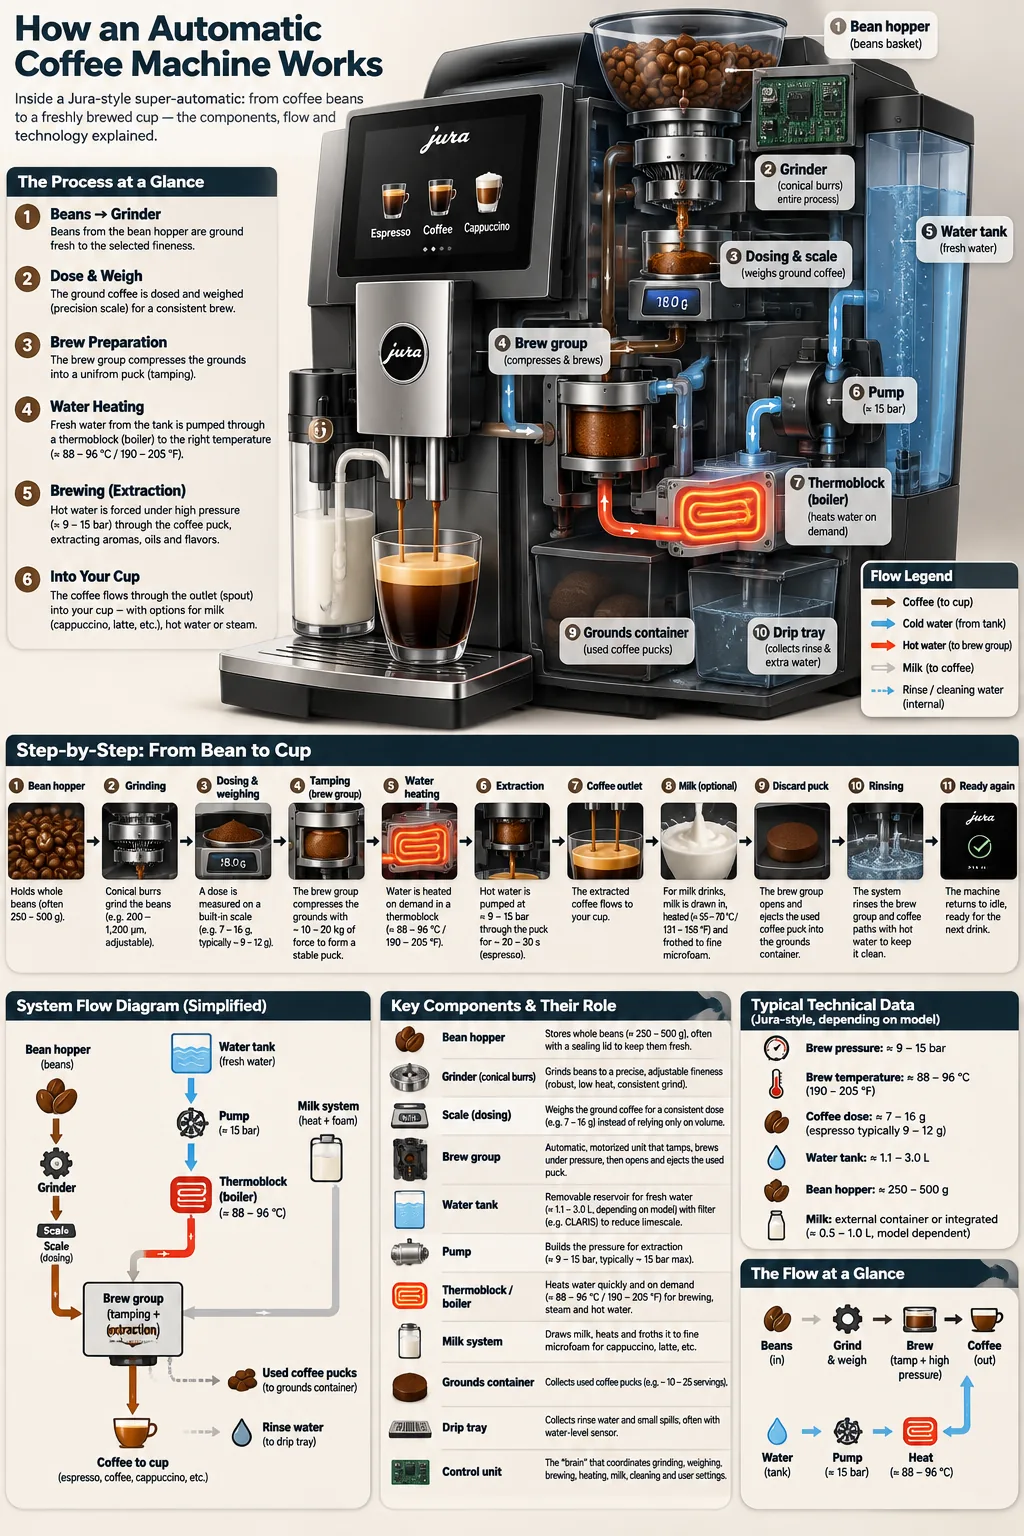
Automatic coffee machine process infographic
GPT Image 2.6 Sunbursten

Create a detailed Infographic of the functioning and flow of an automatic coffee machine like a Jura. From bean basket, to grinding, to scale, water tank, boiler, etc. I'd like to understand technically and visually the flow.