Build the Perfect Taco

Build the Perfect Taco

Documento original

GPT Image 2 · en

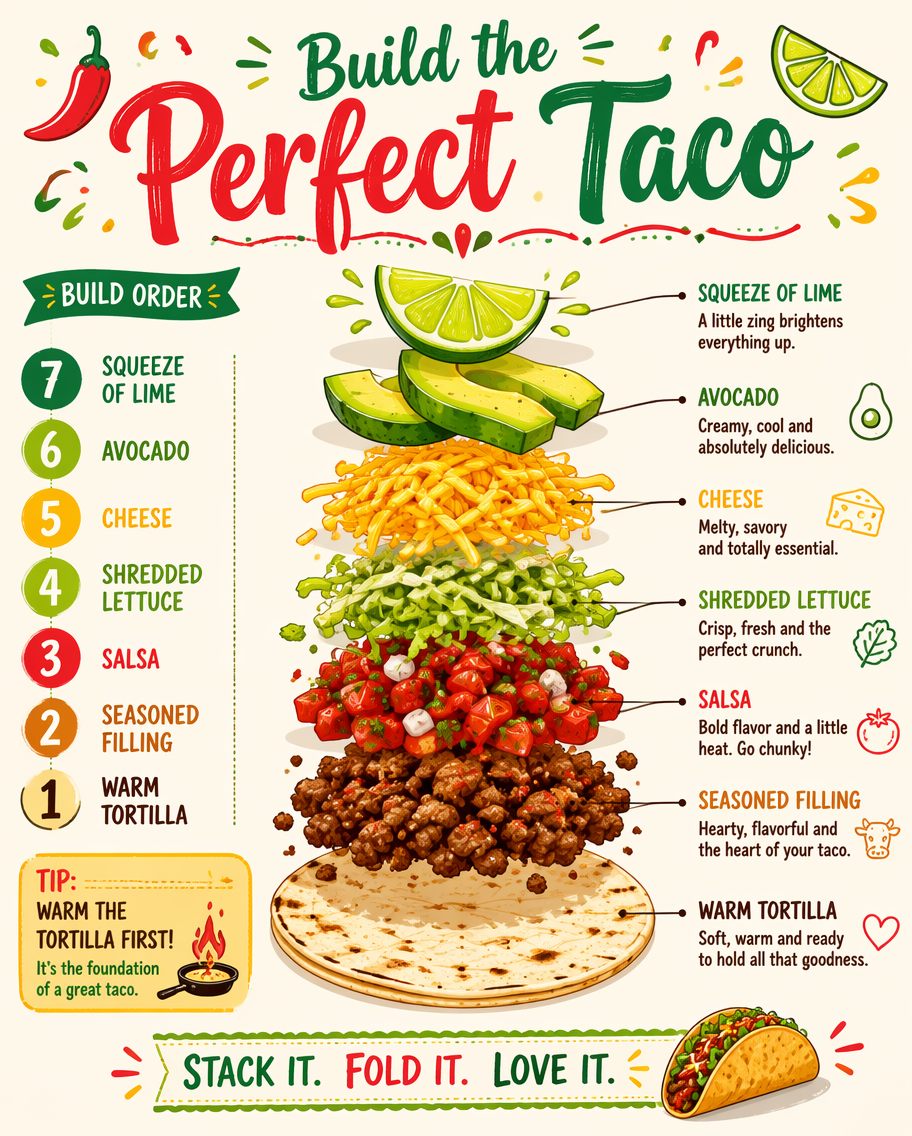
A cooking infographic showing how to build the perfect taco, drawn as an exploded stack of labeled layers plus a numbered assembly order. From a warm tortilla up through seasoned filling, salsa, shredded lettuce, cheese, avocado and a squeeze of lime, each layer has a leader line and a short note. A vibrant fiesta palette of tomato-red, lime-green, corn-yellow and cream, lively flat illustration with soft shadows. Bold hand-lettered title 'Build the Perfect Taco' at the top, small chili and lime doodles, a 'warm the tortilla first' tip.

Cómo usar

  1. Copia el prompt original completo, incluidos los parámetros.
  2. Adapta el tema, el texto y la composición a tus necesidades.
  3. Usa una herramienta externa compatible; comprueba el acceso y el resultado.

Antes de empezar

  • Comprueba si necesita una imagen de referencia. La compatibilidad no demuestra qué modelo generó el ejemplo.
  • Revisa nombres, cifras y textos; el resultado puede variar entre versiones del modelo.
Ejemplos similares

Exploded Taco Infographic — ClawLabs AI · MIT
GPT Image 2en

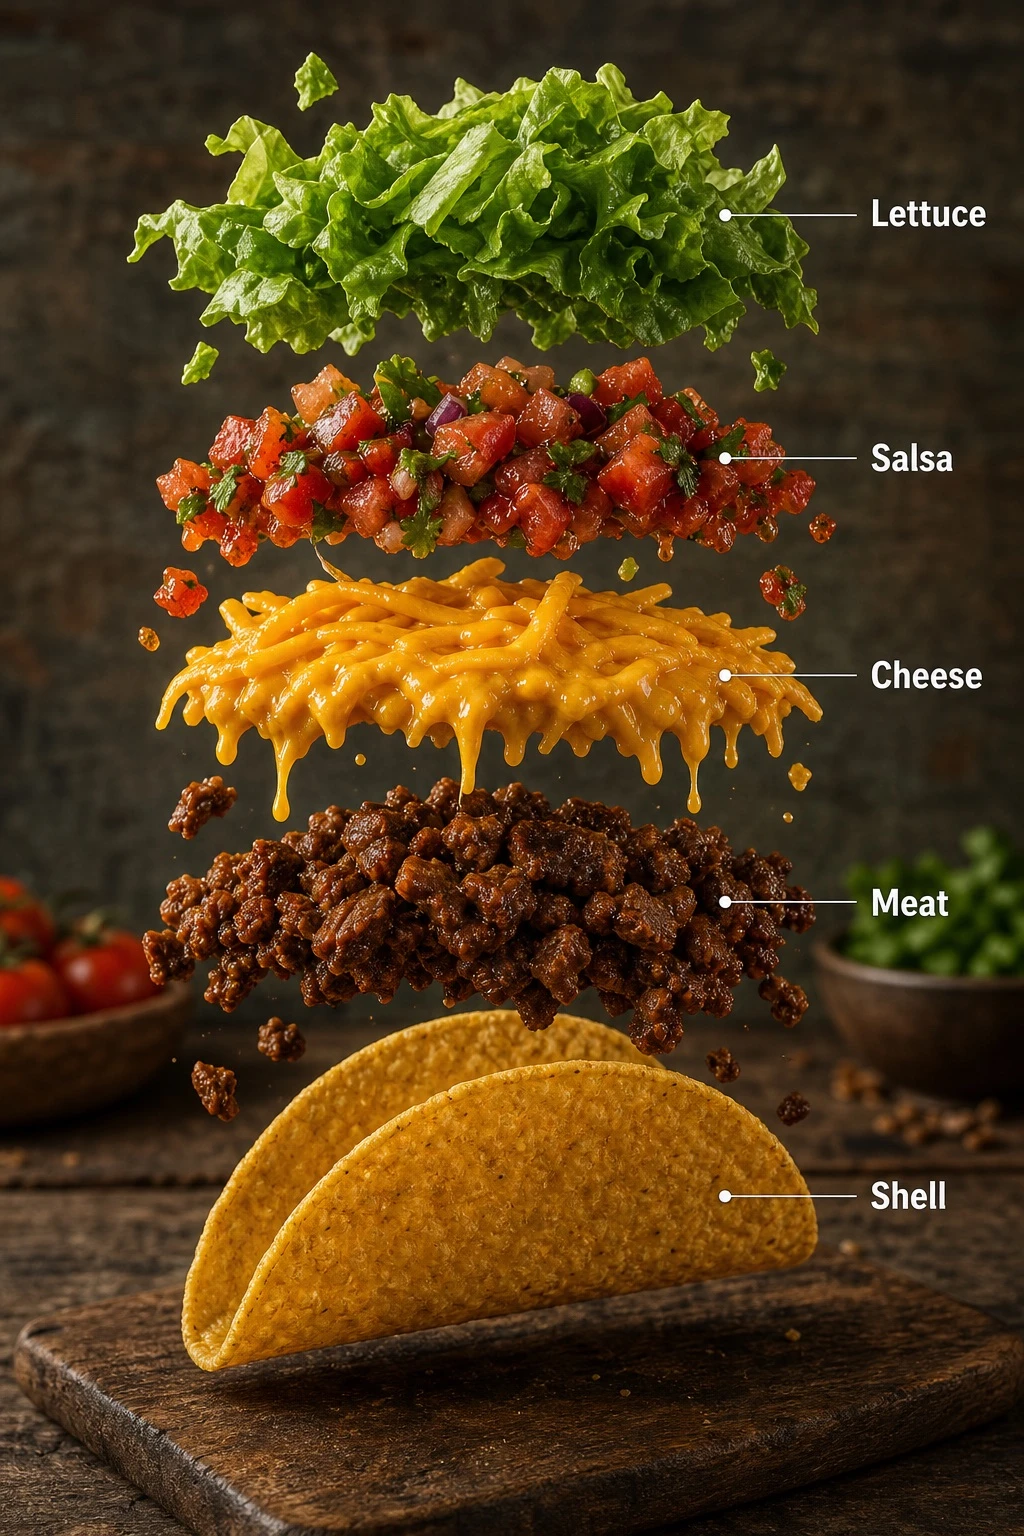
Create a hyper-realistic exploded vertical infographic composition of a taco. Top-to-bottom structure: Fresh lettuce (crisp green texture with natural folds) → Tomato & salsa layer (juicy diced tomatoes and salsa mix) → Melted cheese (smooth cheddar texture) → Grilled meat filli

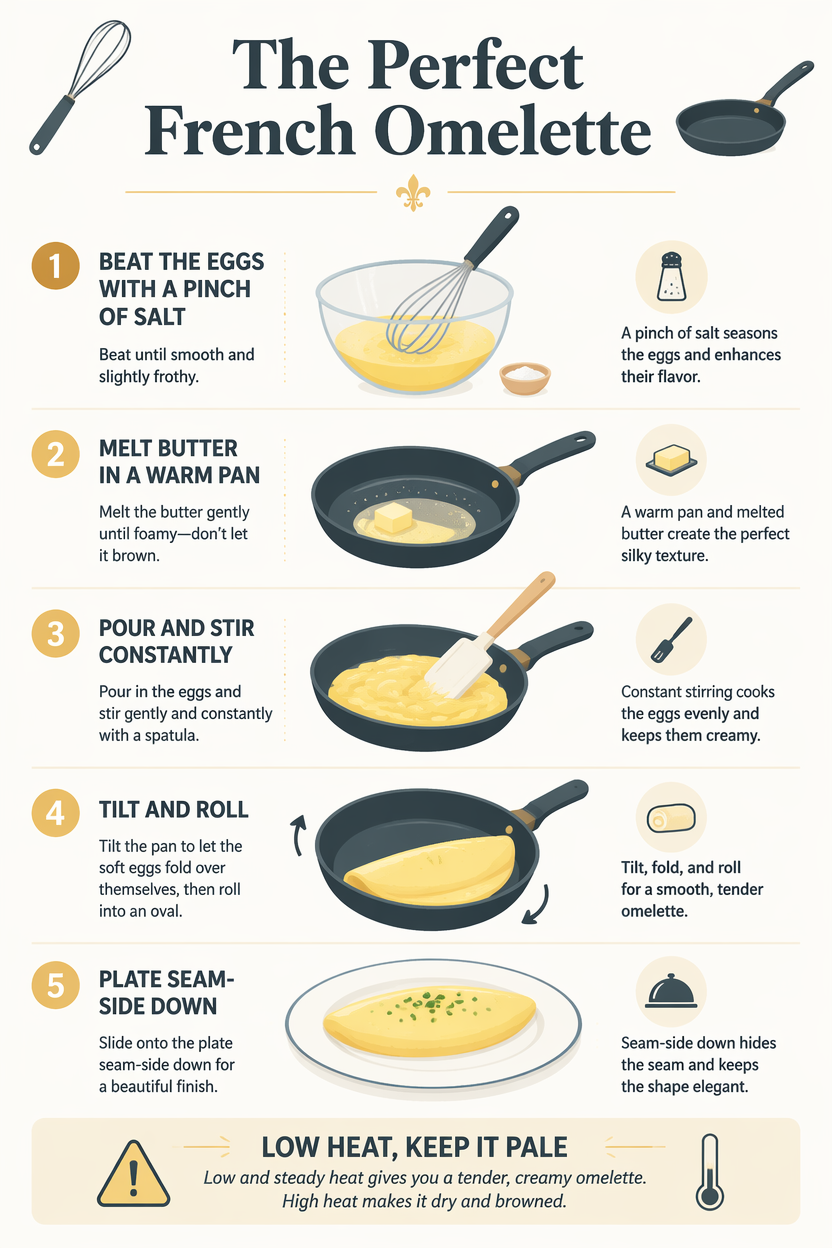
The Perfect French Omelette
GPT Image 2en

A cooking infographic teaching the classic French omelette as a numbered 5-step sequence. Steps - beat the eggs with a pinch of salt, melt butter in a warm pan, pour and stir constantly, tilt and roll, plate seam-side down - each carry a clean side-view illustration and a short t

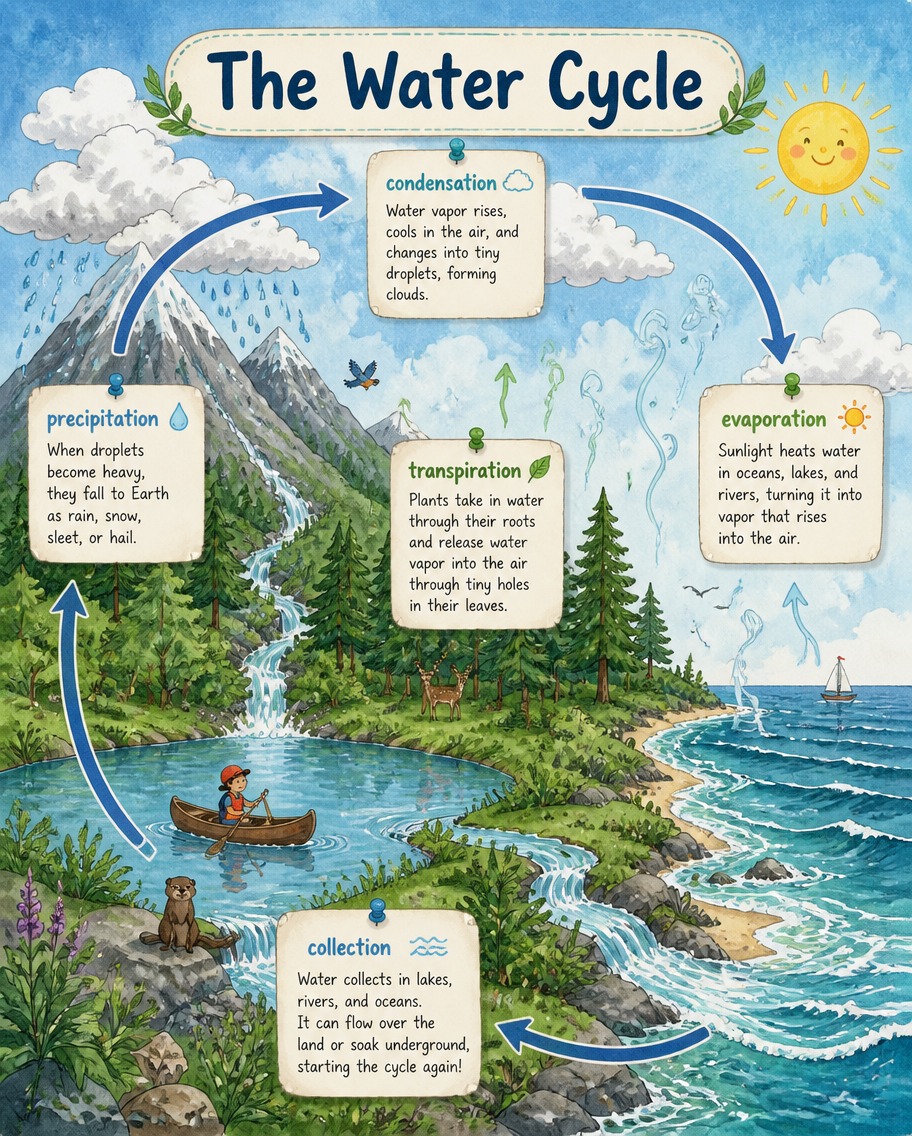
The Water Cycle
GPT Image 2en

An earth-science infographic of the water cycle drawn as one continuous landscape scene. A mountain, forest, lake and ocean sit under a cloud-filled sky, connected by looping arrows labeled 'evaporation', 'condensation', 'precipitation', 'collection' and 'transpiration'. Tiny sun

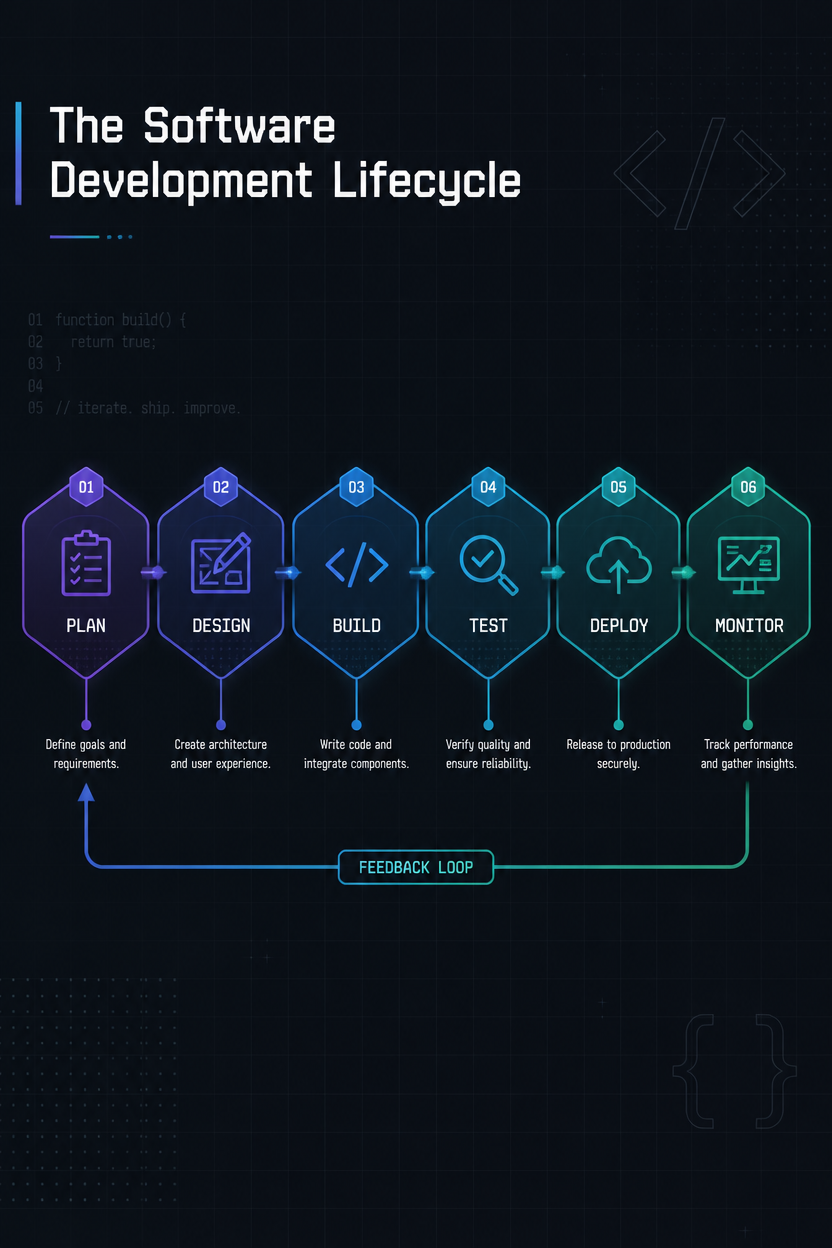
The Software Development Lifecycle
GPT Image 2en

A tech process infographic of the software development lifecycle shown as a horizontal pipeline. Stages - plan, design, build, test, deploy, monitor - appear as connected hexagonal nodes with matching icons and a one-line goal each, plus a feedback arrow looping from monitor back

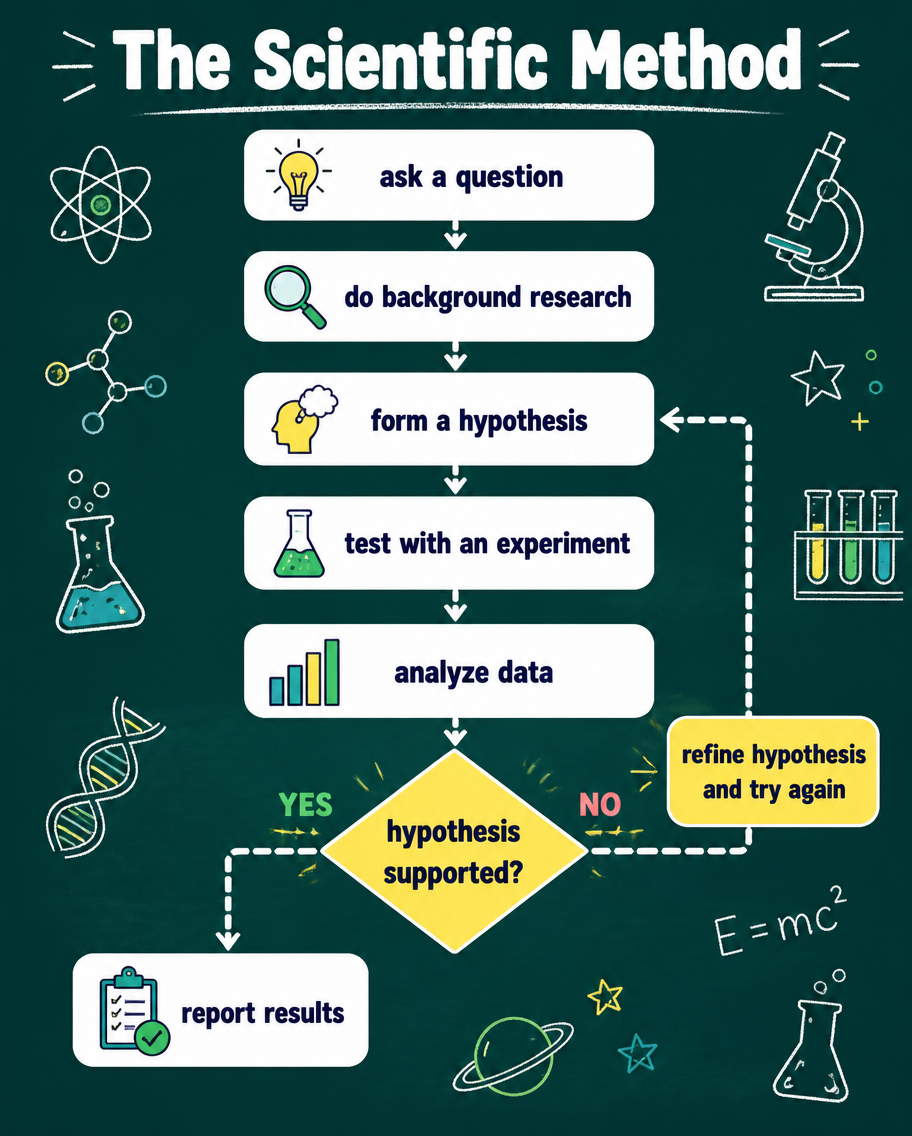
The Scientific Method
GPT Image 2en

An education flowchart infographic of the scientific method drawn as a top-to-bottom decision diagram. Rounded boxes read 'ask a question', 'do background research', 'form a hypothesis', 'test with an experiment', 'analyze data', then a decision diamond 'hypothesis supported?' br