Documento original
GPT Image 2 · en
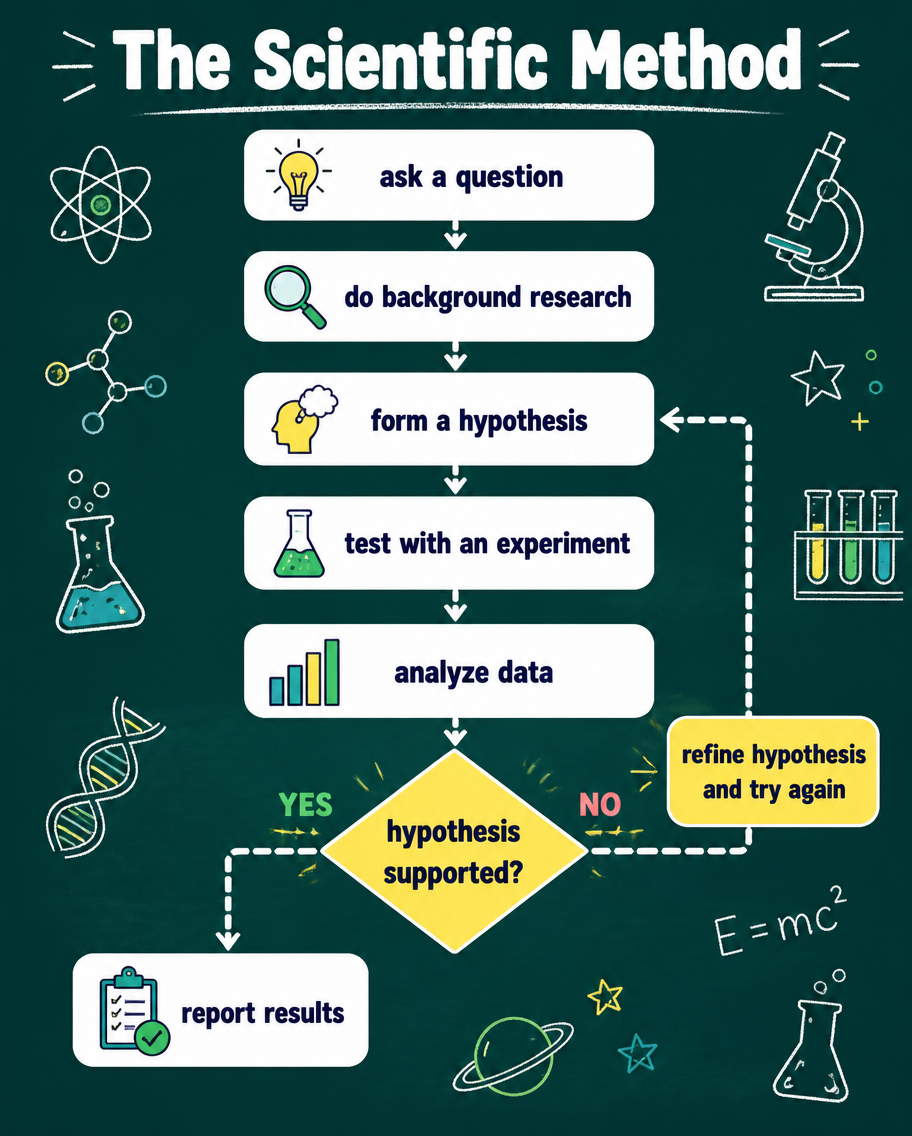
An education flowchart infographic of the scientific method drawn as a top-to-bottom decision diagram. Rounded boxes read 'ask a question', 'do background research', 'form a hypothesis', 'test with an experiment', 'analyze data', then a decision diamond 'hypothesis supported?' branching to 'report results' or looping back to refine. Crisp flat vector, a chalkboard-teal background with white and lemon-yellow nodes, playful science icons (flask, magnifier, lightbulb). Bold title 'The Scientific Method' at the top, dashed arrows between steps.Cómo usar
- Copia el prompt original completo, incluidos los parámetros.
- Adapta el tema, el texto y la composición a tus necesidades.
- Usa una herramienta externa compatible; comprueba el acceso y el resultado.
Antes de empezar
- Comprueba si necesita una imagen de referencia. La compatibilidad no demuestra qué modelo generó el ejemplo.
- Revisa nombres, cifras y textos; el resultado puede variar entre versiones del modelo.