Documento originale
GPT Image 2 · en
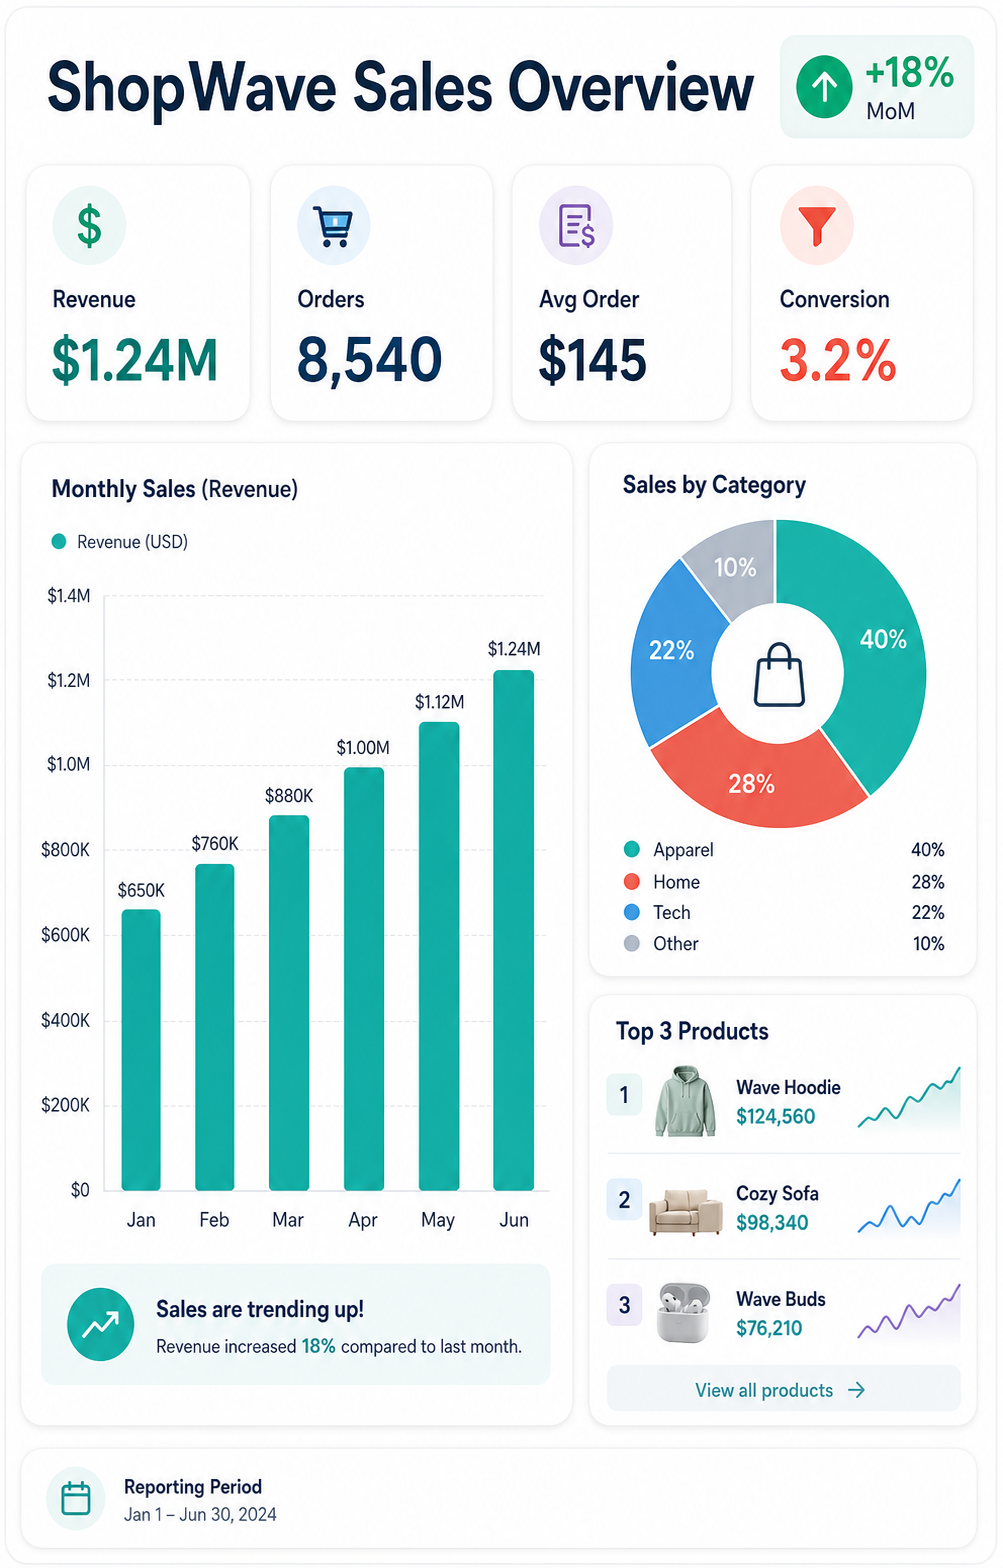
A dashboard infographic, 4:5, titled 'ShopWave Sales Overview'. A report slide with four top stat tiles: Revenue $1.24M, Orders 8,540, Avg Order $145, Conversion 3.2%. A central bar chart shows monthly sales rising Jan-Jun, a side donut splits categories (Apparel 40%, Home 28%, Tech 22%, Other 10%), and a small ranked list of top 3 products with mini sparklines. A green up-arrow trend badge '+18% MoM'. Clean white-and-slate dashboard palette, teal and coral accents, rounded widgets, soft shadows, sleek e-commerce analytics aesthetic.Come usare
- Copia tutto il prompt originale, inclusi i parametri.
- Adatta soggetto, testo e composizione alle tue esigenze.
- Usa uno strumento esterno compatibile; verifica accesso e risultato.
Prima di iniziare
- Controlla se serve un’immagine di riferimento. La compatibilità non prova il modello usato per l’esempio.
- Verifica nomi, numeri e testi; i risultati cambiano con le versioni del modello.