Original document
GPT Image 2 · en
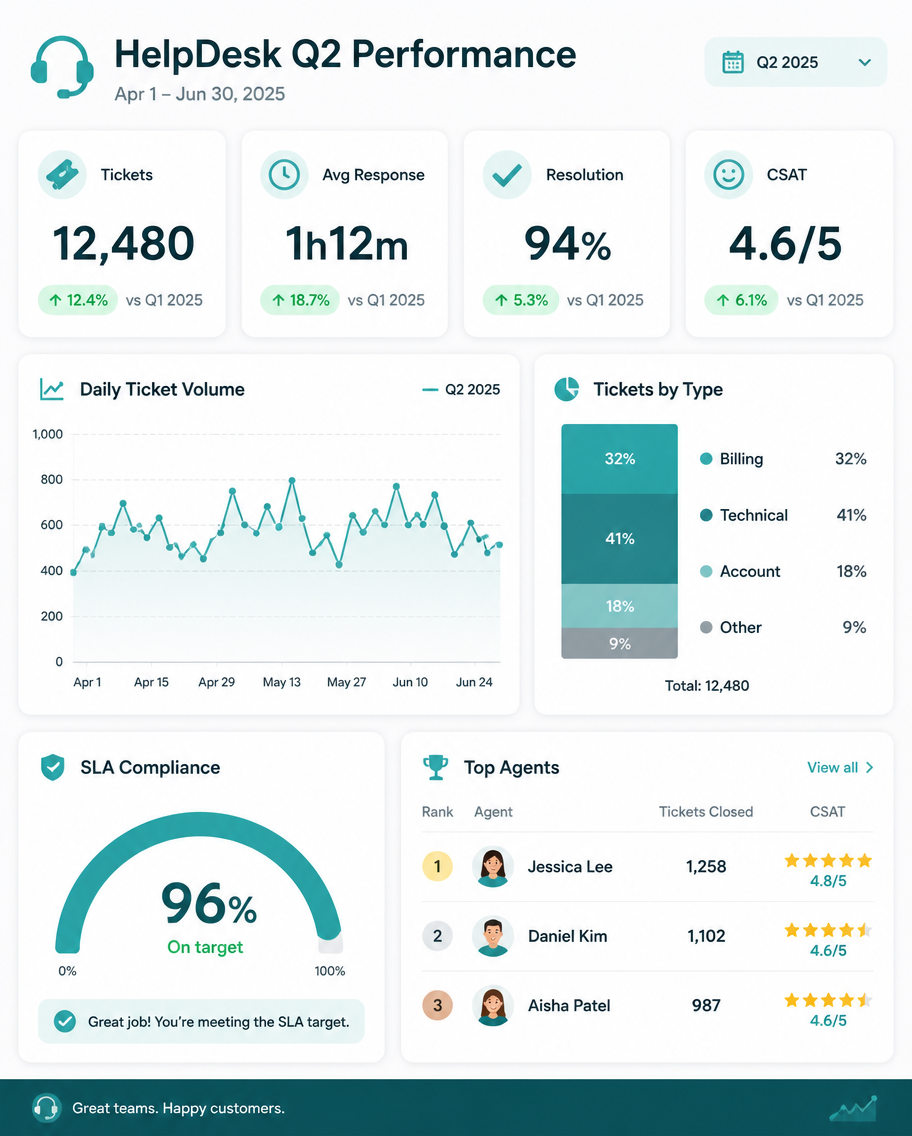
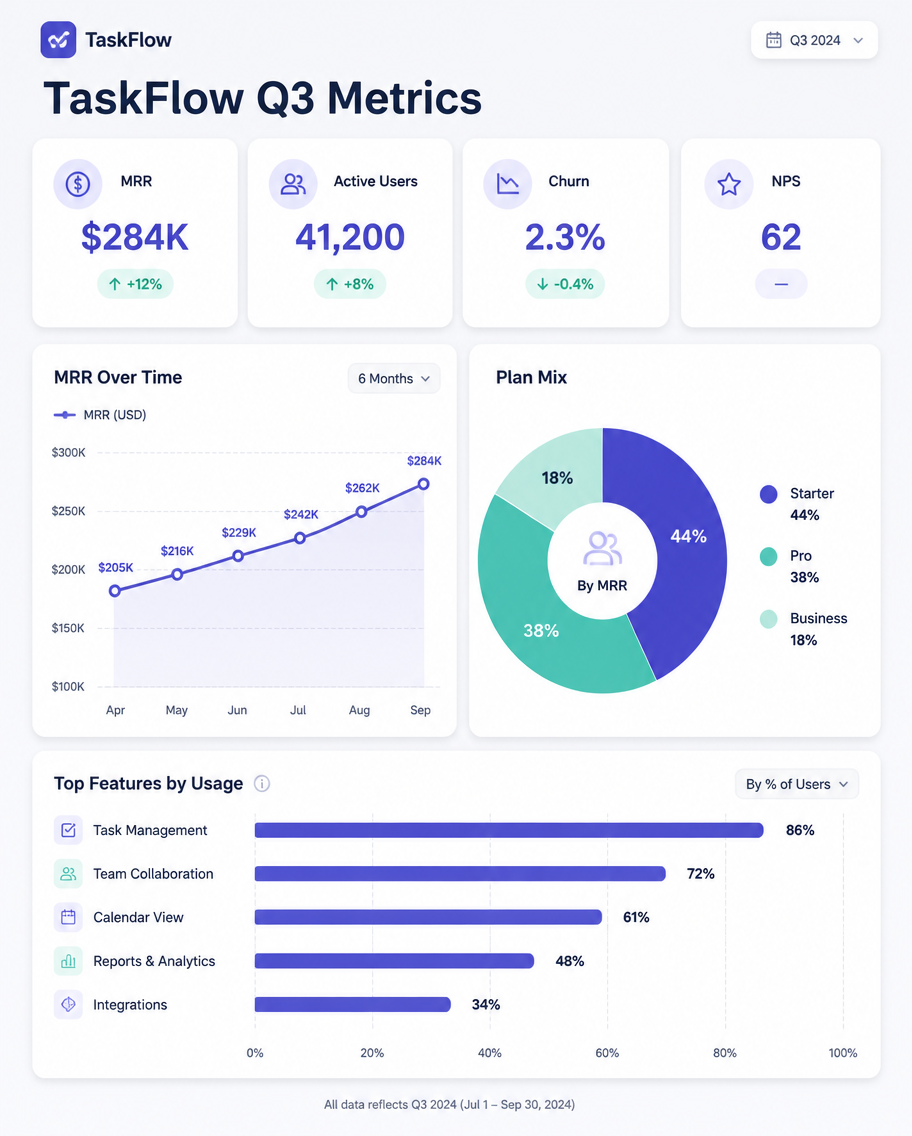
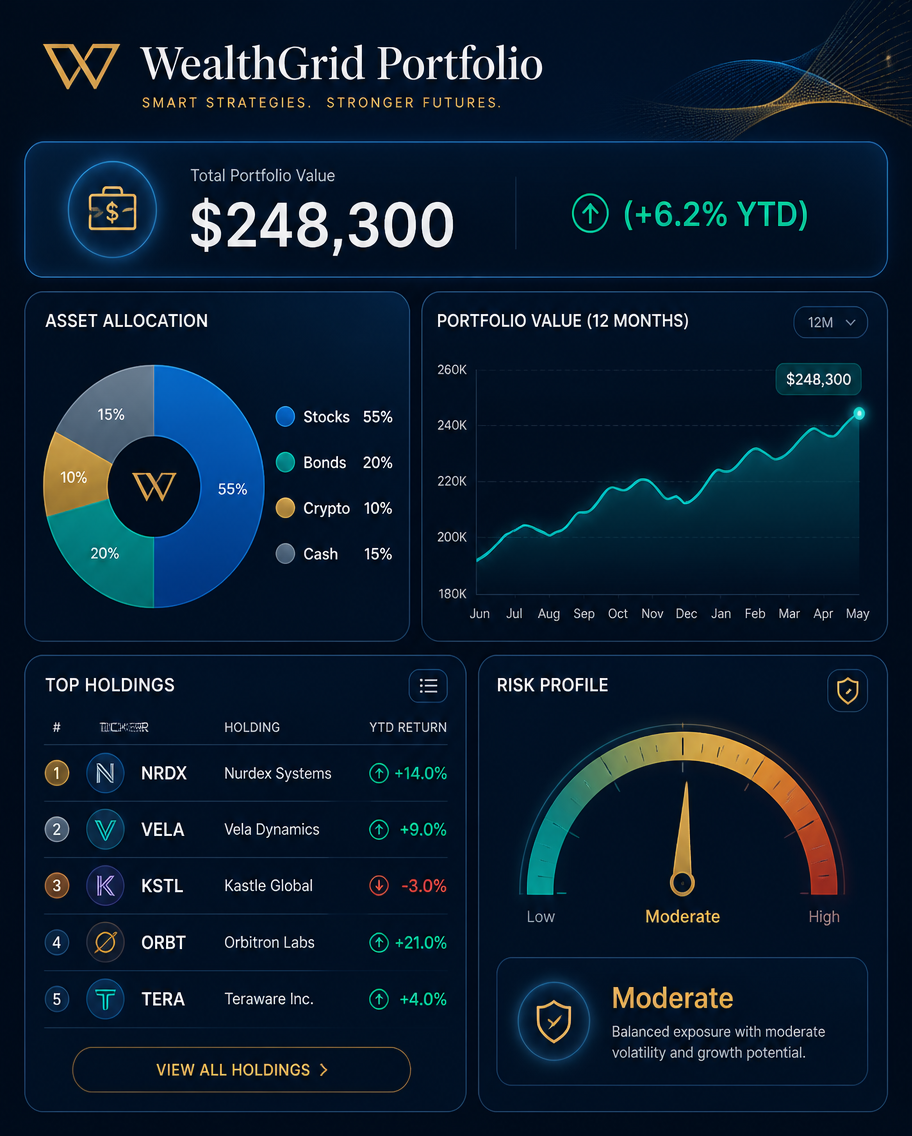
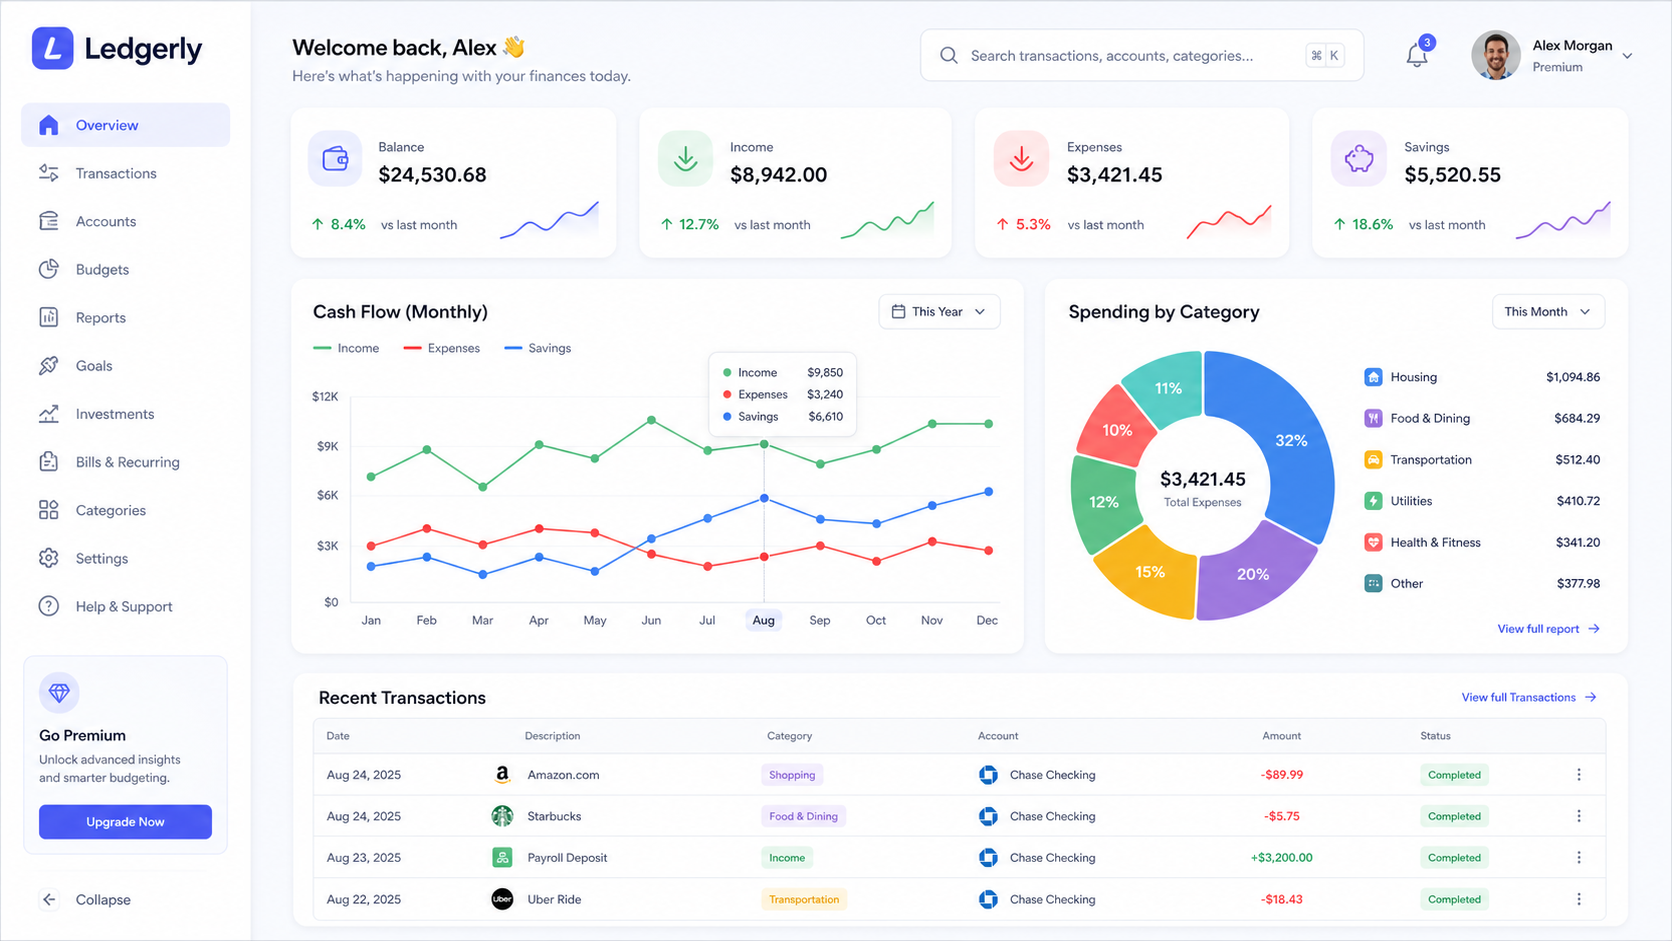
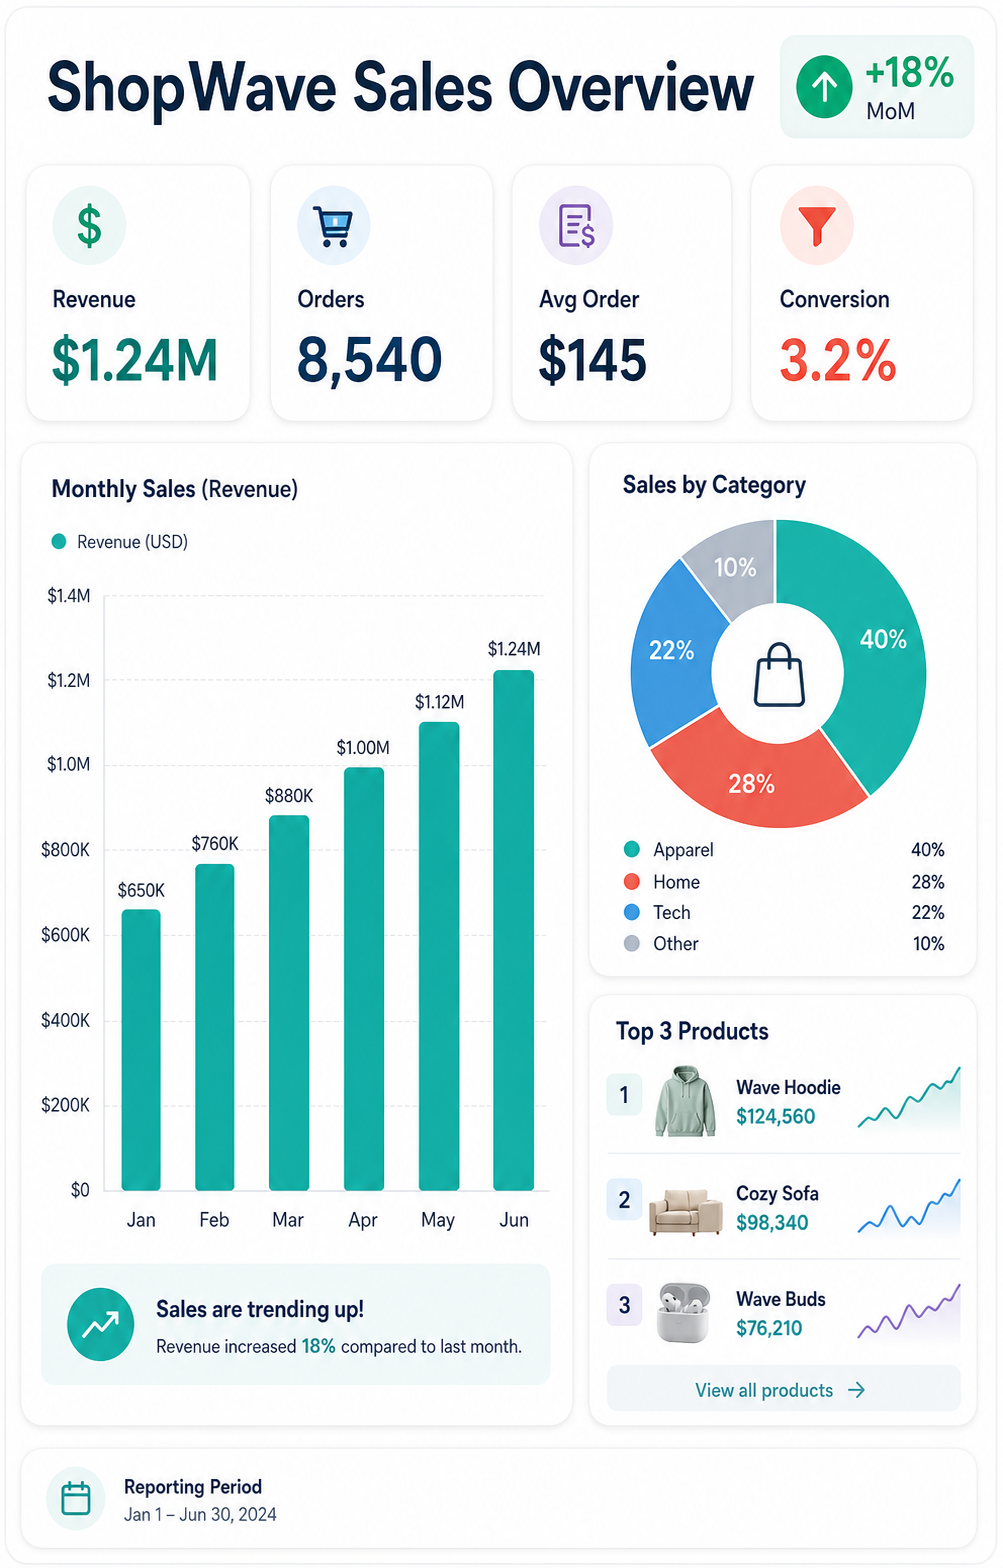
A dashboard infographic, 4:5, titled 'ShopWave Sales Overview'. A report slide with four top stat tiles: Revenue $1.24M, Orders 8,540, Avg Order $145, Conversion 3.2%. A central bar chart shows monthly sales rising Jan-Jun, a side donut splits categories (Apparel 40%, Home 28%, Tech 22%, Other 10%), and a small ranked list of top 3 products with mini sparklines. A green up-arrow trend badge '+18% MoM'. Clean white-and-slate dashboard palette, teal and coral accents, rounded widgets, soft shadows, sleek e-commerce analytics aesthetic.How to use
- Copy the complete original prompt, including any parameters.
- Replace the subject, text and composition with your own requirements.
- Use a compatible external tool; check its current access conditions and review the result.
Before you start
- Check whether a reference image is required. A compatible model label does not mean this example was generated with that model.
- Keep names, figures and visible text accurate; results can vary between model versions.