Design illustration · Coffee Vs Tea Versus — API Models · CC BY 4.0

Design illustration · Coffee Vs Tea Versus — API Models · CC BY 4.0

原文

GPT Image 2 · en

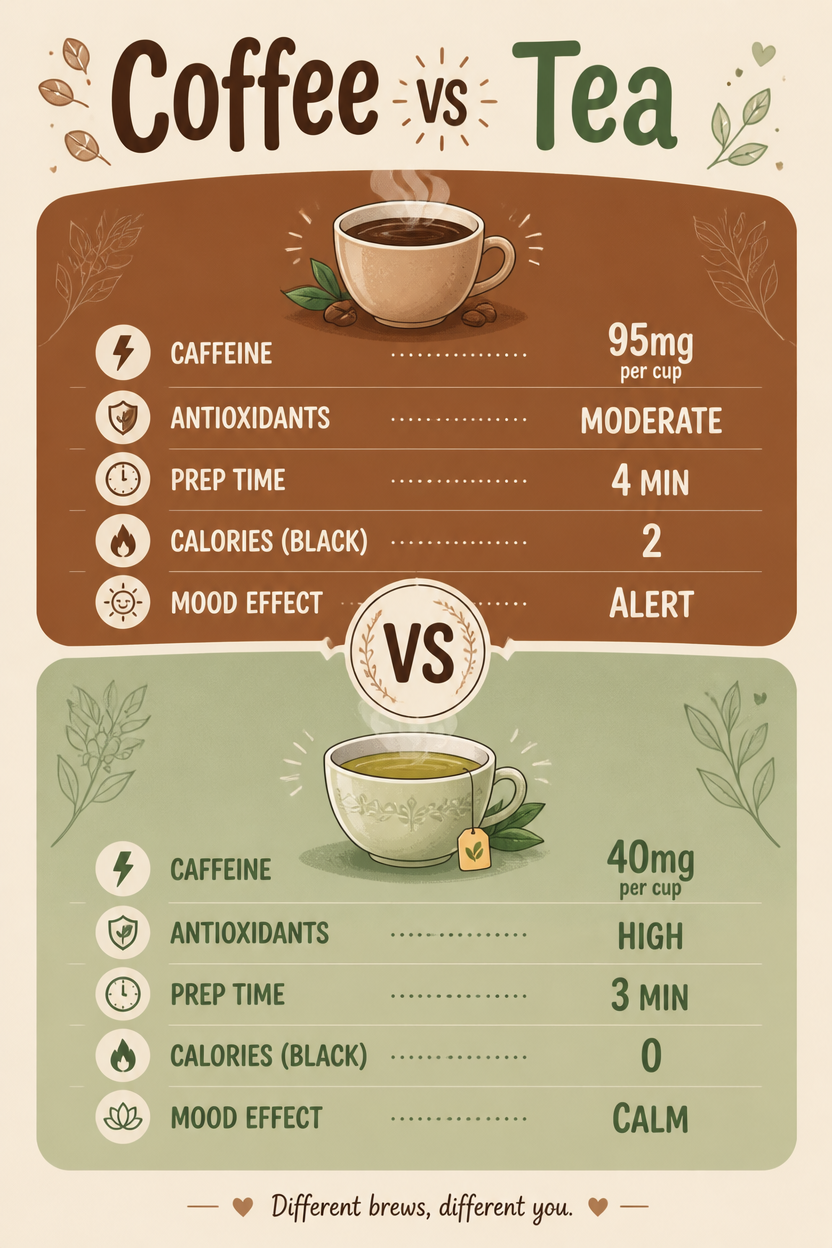
A versus infographic, 2:3, titled 'Coffee vs Tea'. Vertical split: top warm coffee-brown for Coffee, bottom soft sage-green for Tea, meeting at a central 'VS' seal. Matched rows compare caffeine (95mg vs 40mg per cup), antioxidants (moderate vs high), prep time (4 vs 3 min), calories black (2 vs 0), mood effect (alert vs calm). A steaming cup icon crowns each section. Cozy flat illustration style, warm cream background, hand-drawn steam swirls, rounded typography, balanced symmetrical head-to-head layout.

使い方

  1. パラメータを含む元のプロンプト全体をコピーします。
  2. 被写体、文字、構図を自分の要件に置き換えます。
  3. 対応する外部ツールで使用し、利用条件と結果を確認します。

開始前の確認

  • 参考画像の要否を確認してください。互換モデルの表示は、そのモデルでの生成実績を意味しません。
  • 名前、数値、画像内の文字を確認します。モデルの版で結果は変わります。
似た事例

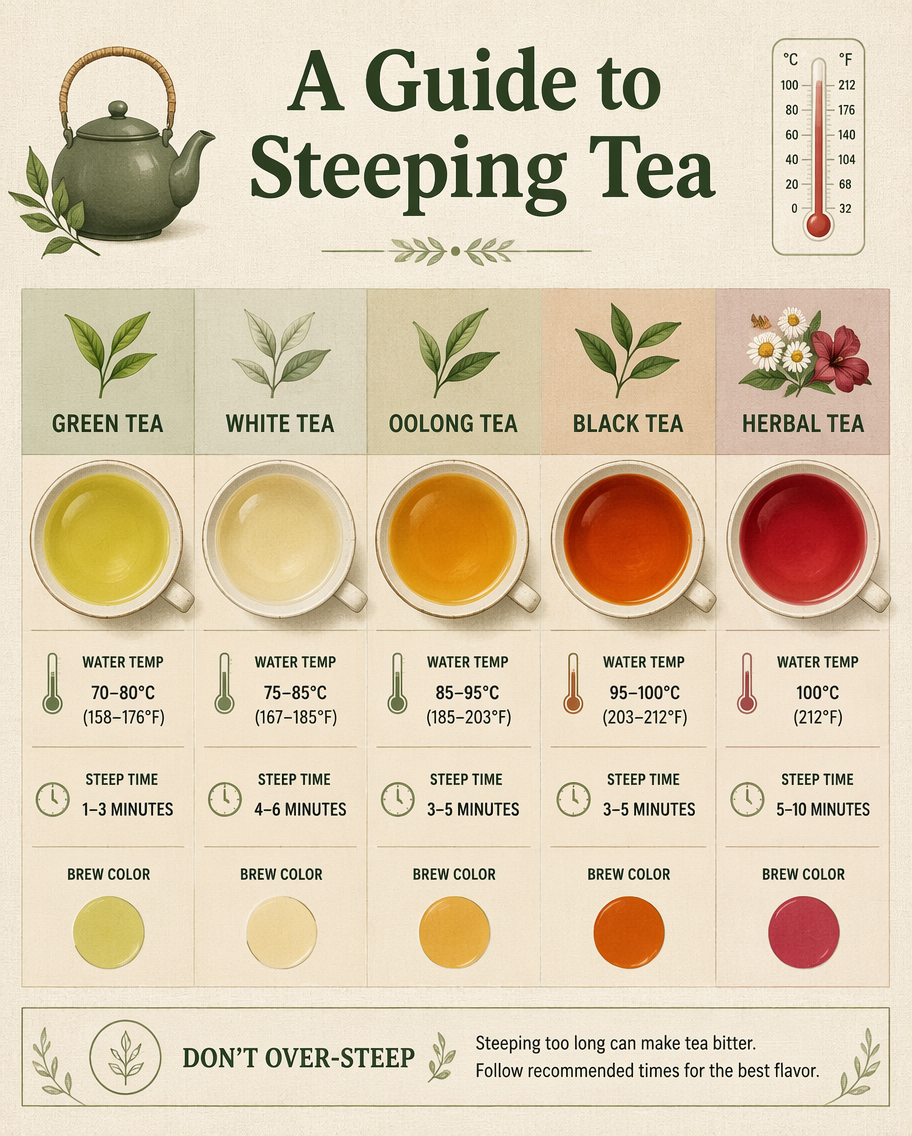
A Guide to Steeping Tea
GPT Image 2en

A cooking infographic guide to steeping tea by type, laid out as a comparison chart of five cups in a row. Columns for green, white, oolong, black and herbal tea each list water temperature, steep time and a color swatch of the brew, topped by a small leaf icon. A calm natural pa

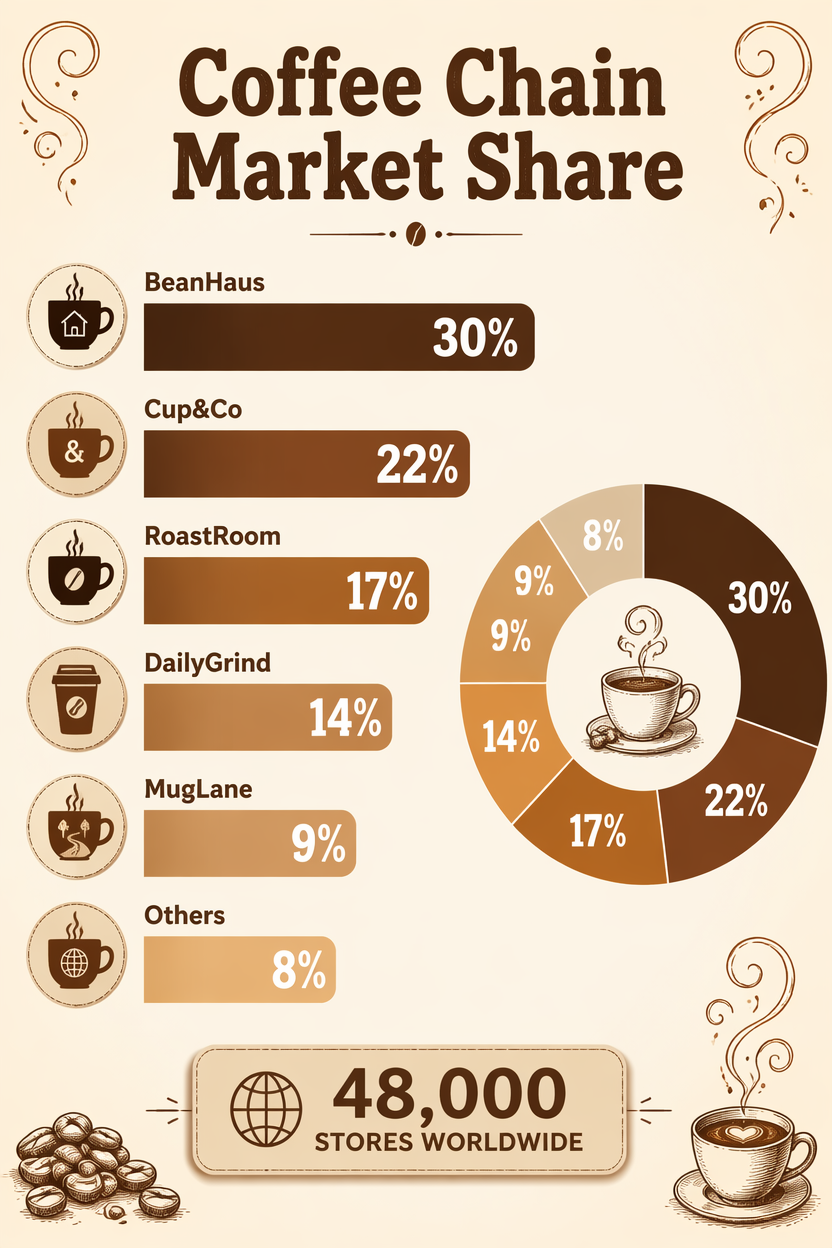
Coffee Chain Market Share
GPT Image 2en

A retail market-share infographic, 2:3, titled 'Coffee Chain Market Share'. A horizontal bar ranking of invented chains: BeanHaus 30%, Cup&Co 22%, RoastRoom 17%, DailyGrind 14%, MugLane 9%, Others 8%, each bar in a warm brown-to-caramel gradient with bold percentages. Small coffe