Original document
GPT Image 2 · en
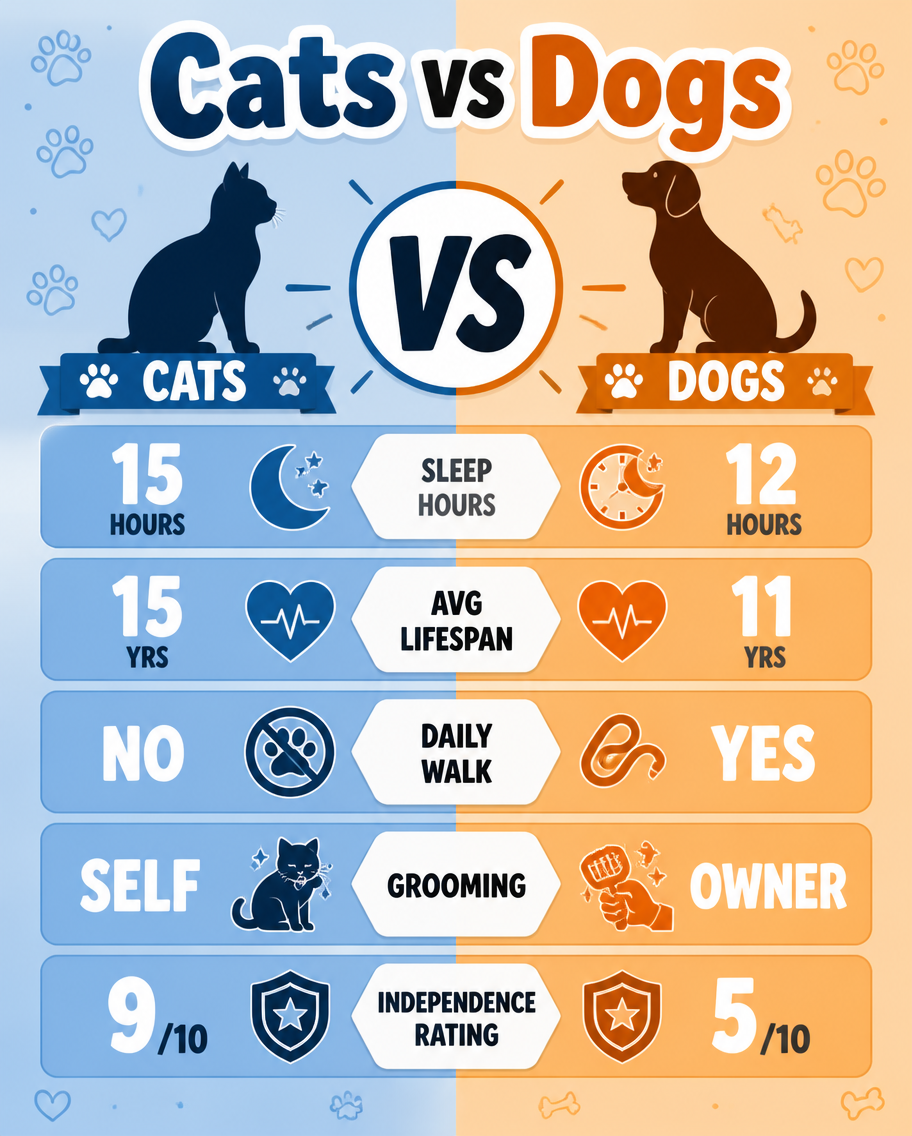
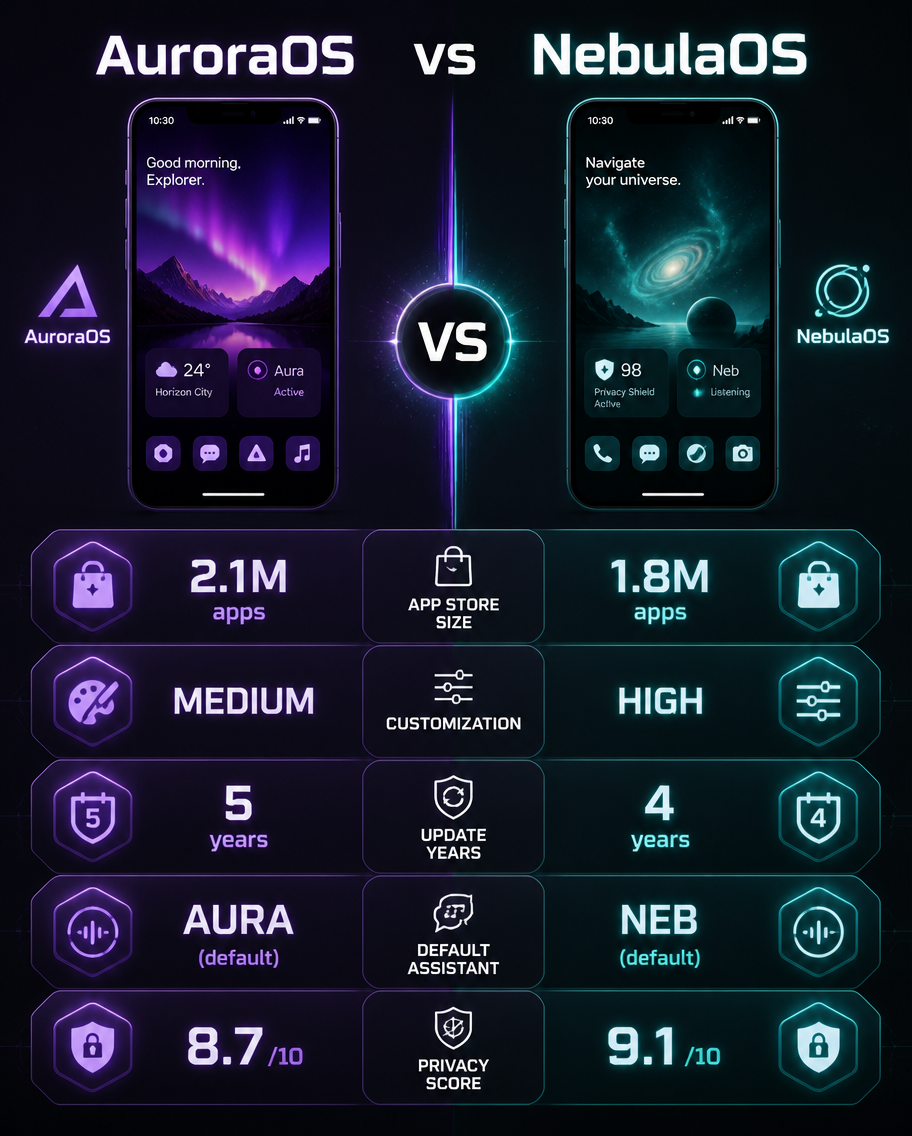
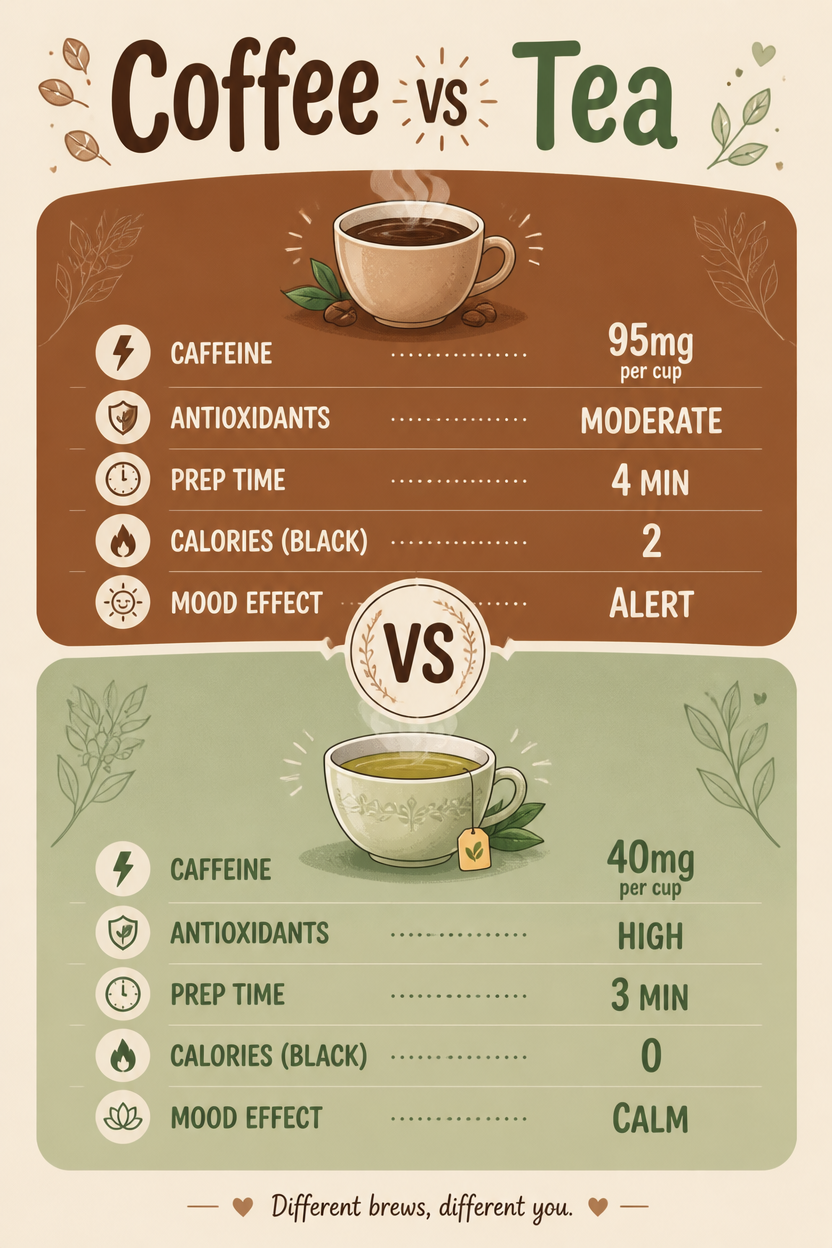
A versus infographic, 2:3, titled 'Coffee vs Tea'. Vertical split: top warm coffee-brown for Coffee, bottom soft sage-green for Tea, meeting at a central 'VS' seal. Matched rows compare caffeine (95mg vs 40mg per cup), antioxidants (moderate vs high), prep time (4 vs 3 min), calories black (2 vs 0), mood effect (alert vs calm). A steaming cup icon crowns each section. Cozy flat illustration style, warm cream background, hand-drawn steam swirls, rounded typography, balanced symmetrical head-to-head layout.How to use
- Copy the complete original prompt, including any parameters.
- Replace the subject, text and composition with your own requirements.
- Use a compatible external tool; check its current access conditions and review the result.
Before you start
- Check whether a reference image is required. A compatible model label does not mean this example was generated with that model.
- Keep names, figures and visible text accurate; results can vary between model versions.