原文
GPT Image 2 · en
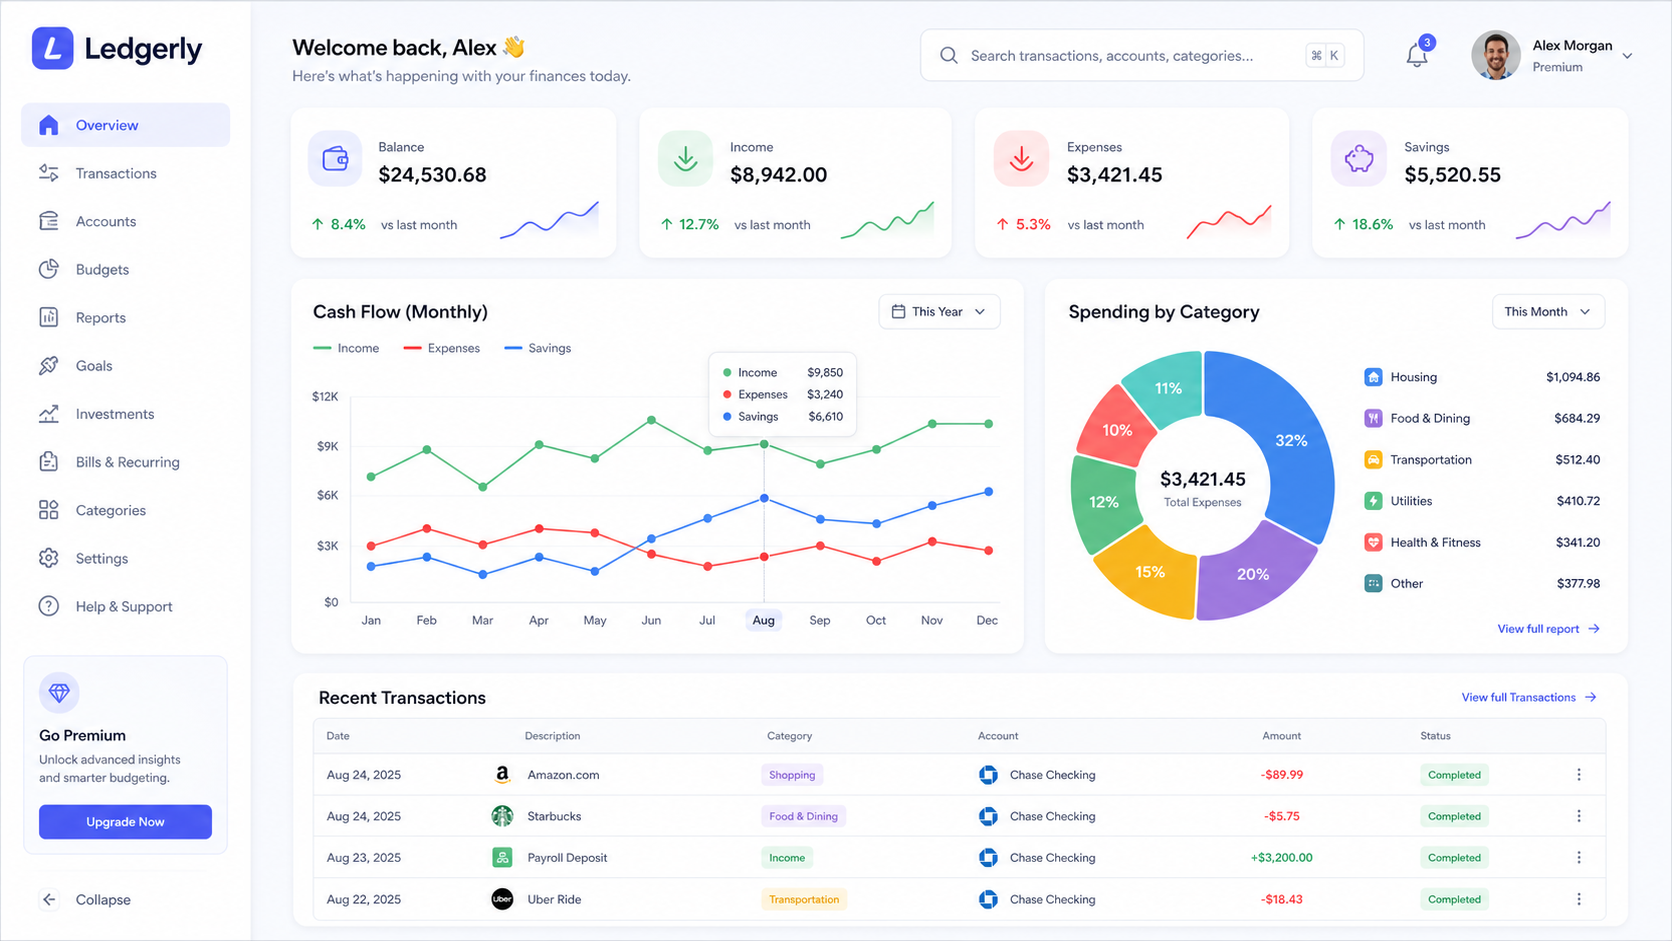
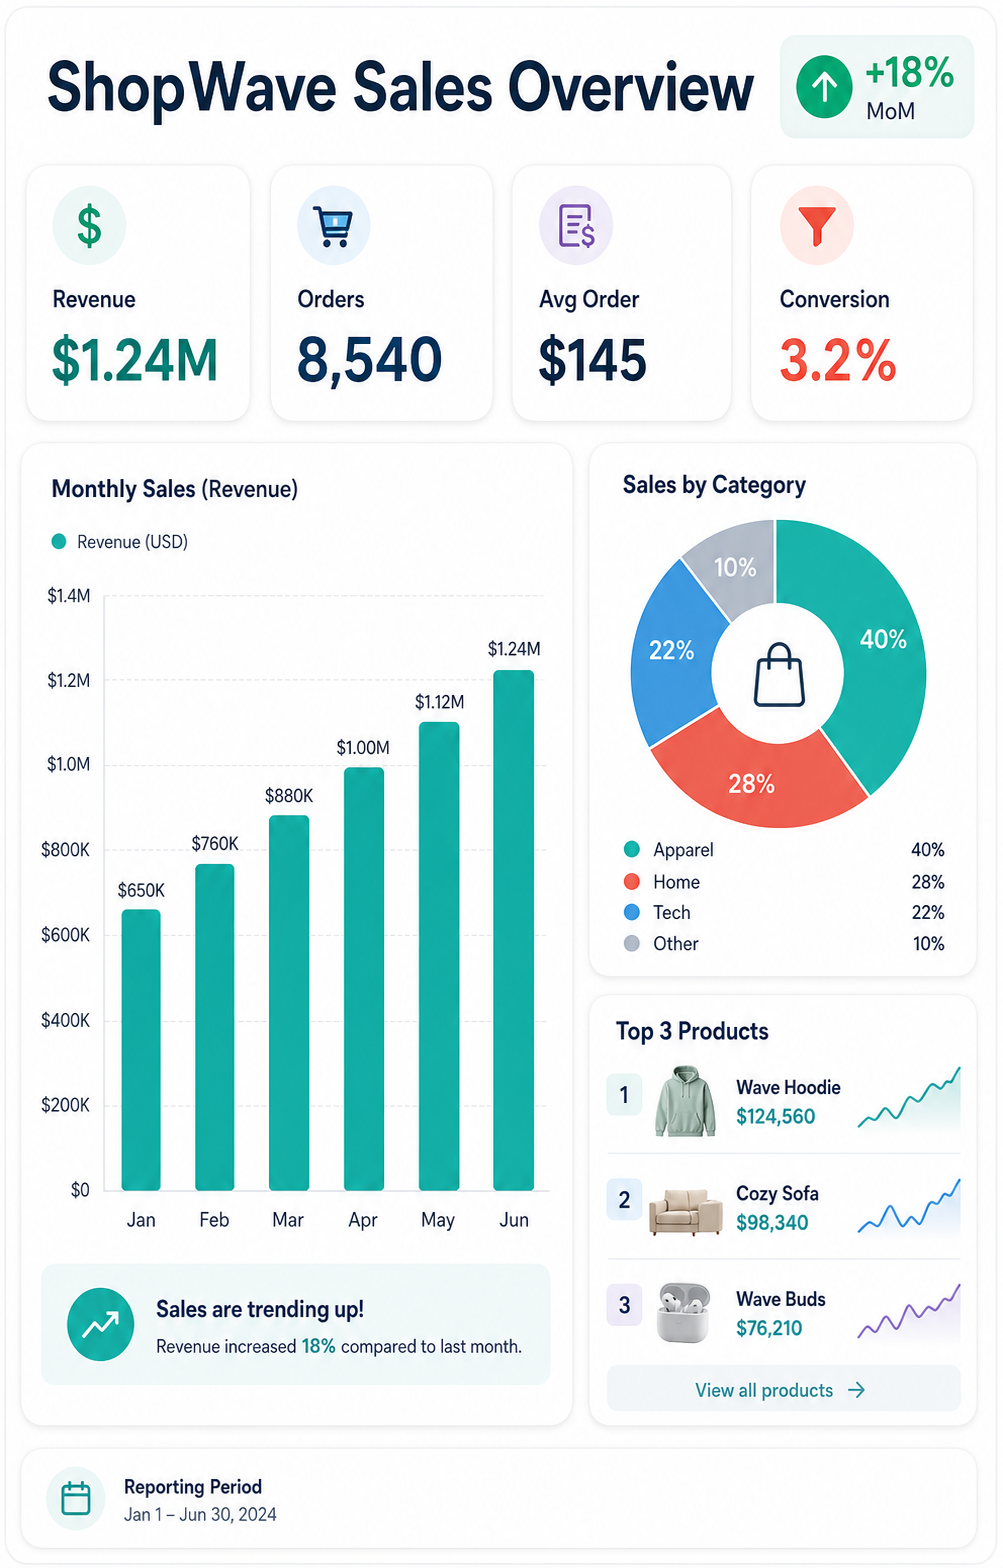
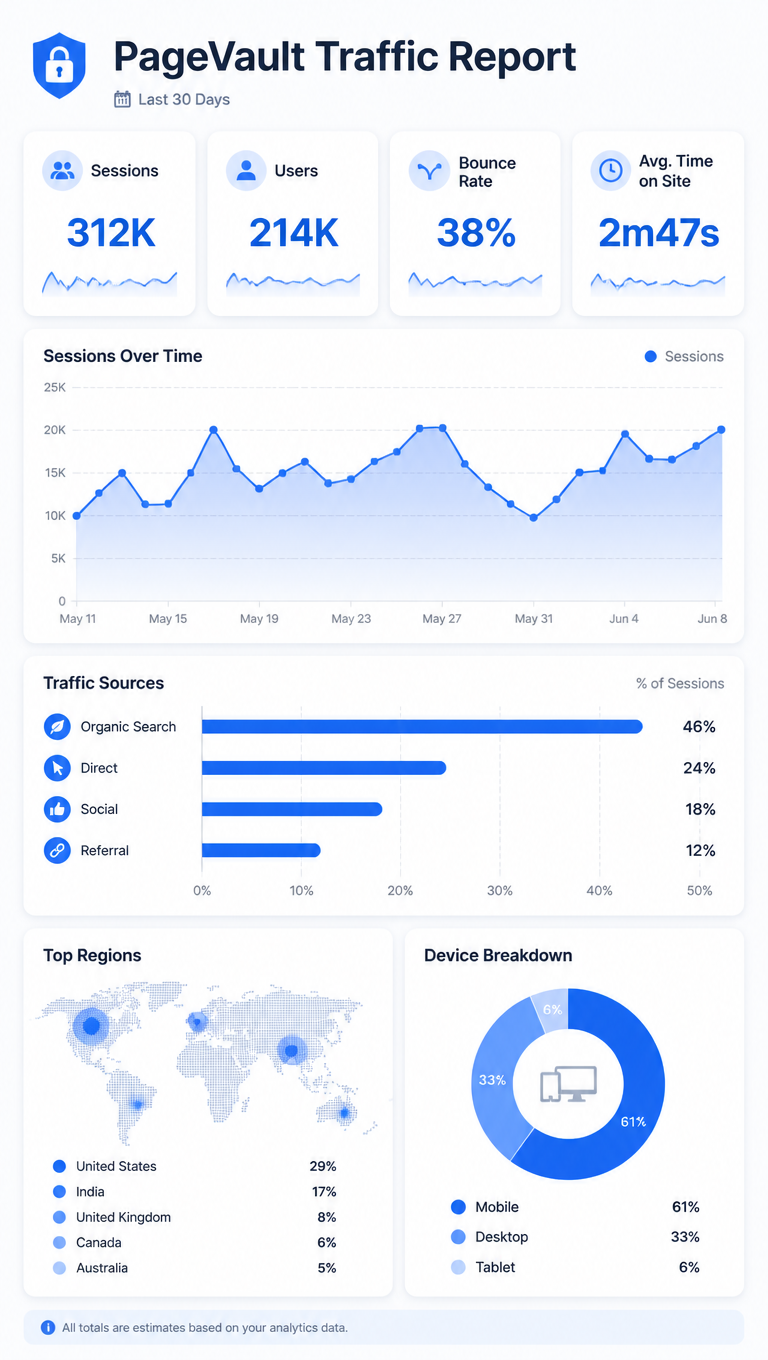
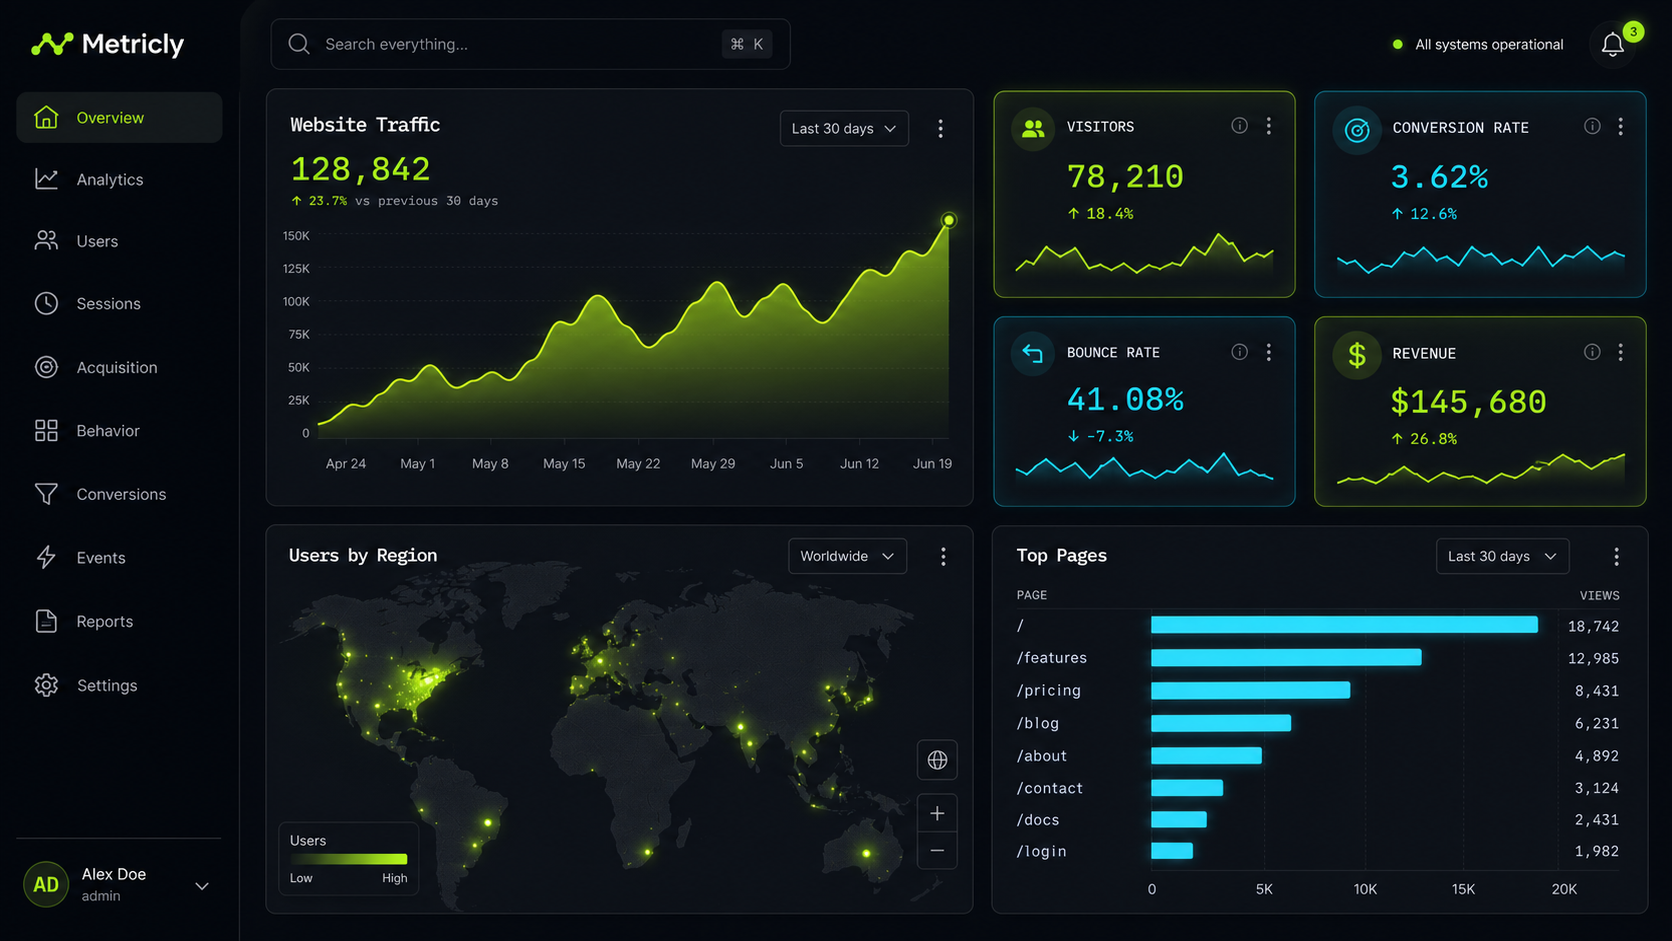
A dark-mode analytics dashboard UI mockup for a product named 'Metricly'. Left icon-rail navigation, top bar with global search and notification bell. Main grid: a large area chart of website traffic with a gradient fill, four small metric tiles (visitors, conversion, bounce rate, revenue) with tiny sparklines, a world map with glowing dots for user regions, and a bar chart of top pages. Charcoal background, neon-lime and cyan accents, glowing cards, crisp monospaced numbers, sleek modern data-viz, 16:9.使い方
- パラメータを含む元のプロンプト全体をコピーします。
- 被写体、文字、構図を自分の要件に置き換えます。
- 対応する外部ツールで使用し、利用条件と結果を確認します。
開始前の確認
- 参考画像の要否を確認してください。互換モデルの表示は、そのモデルでの生成実績を意味しません。
- 名前、数値、画像内の文字を確認します。モデルの版で結果は変わります。