原始文档
GPT Image 2 · en
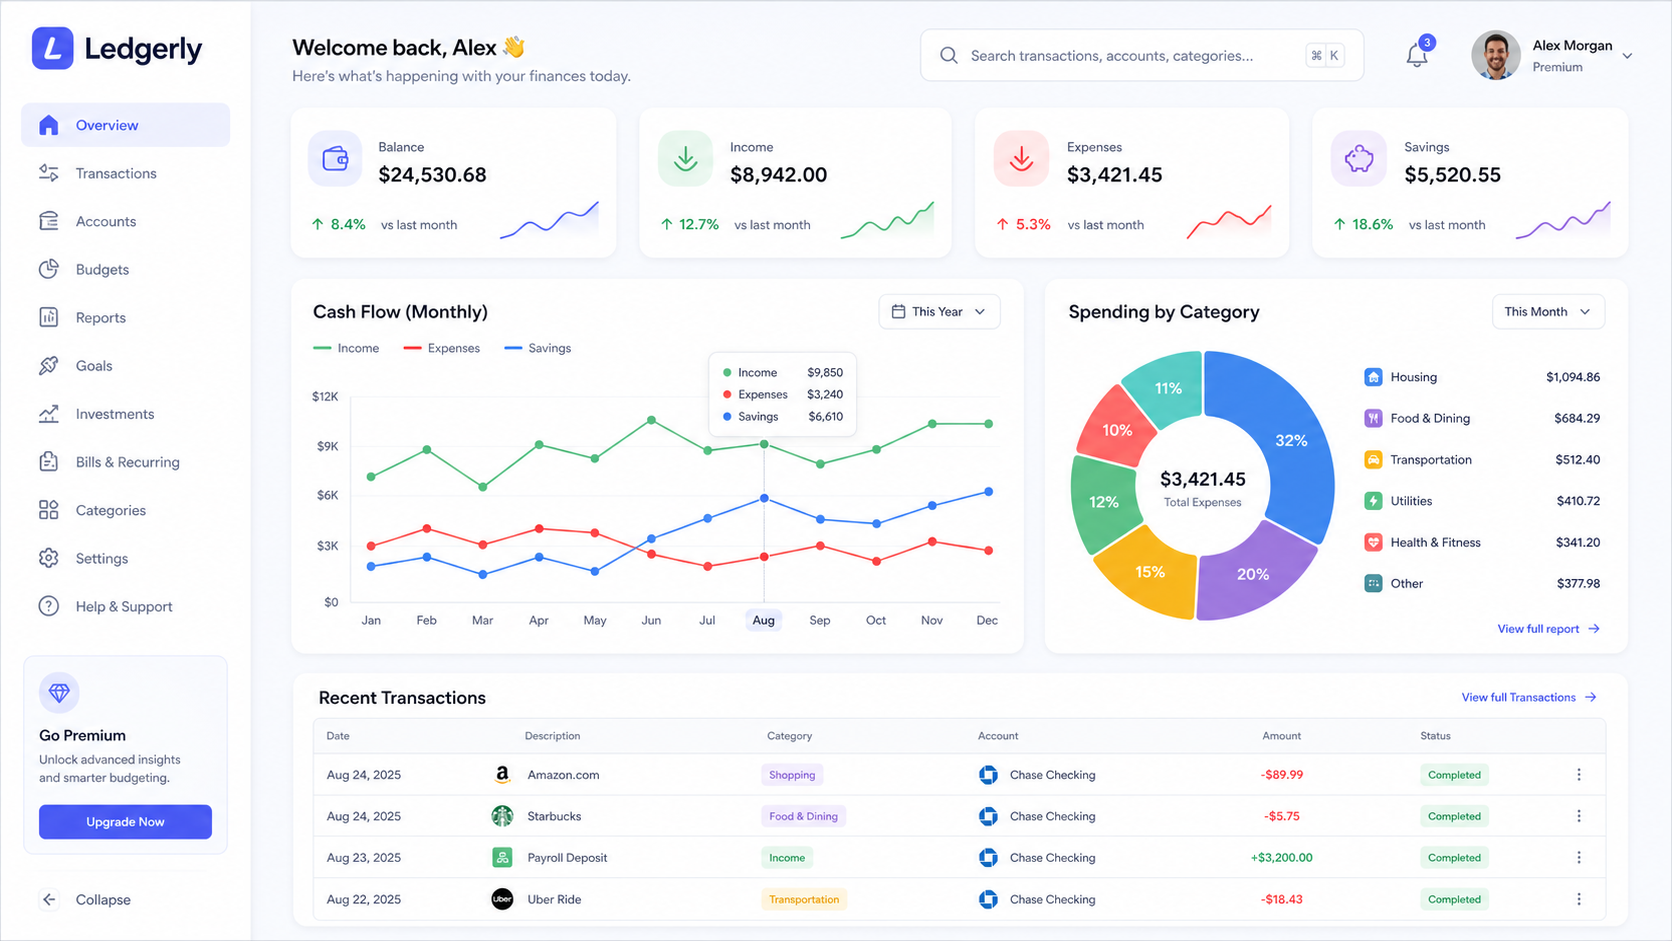
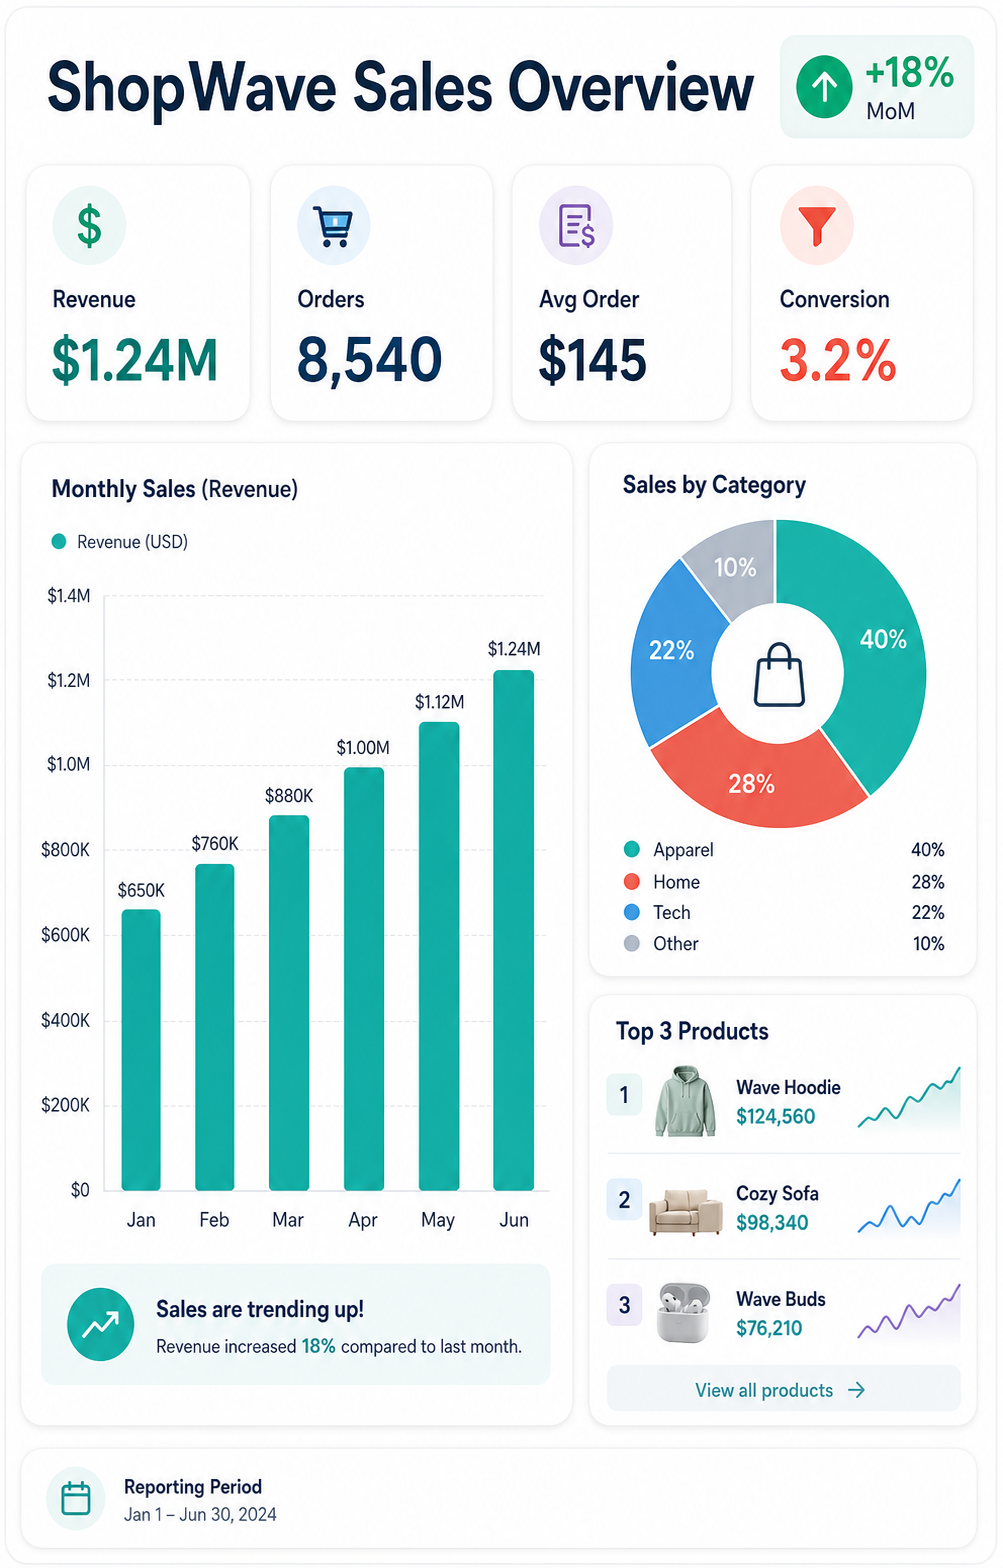
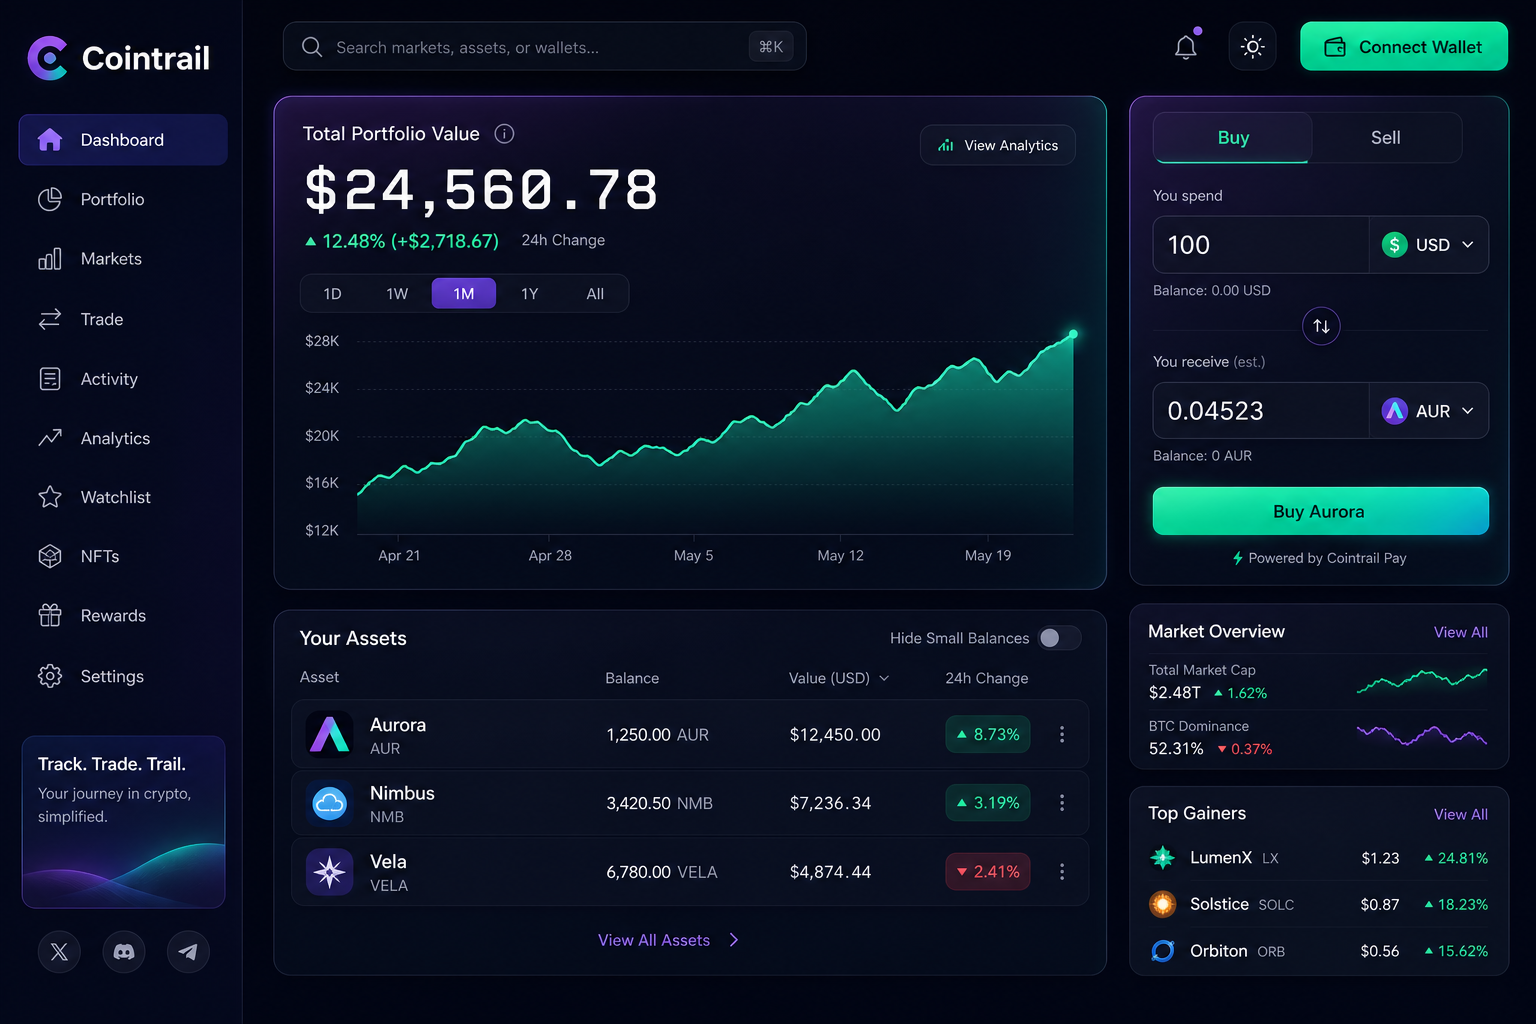
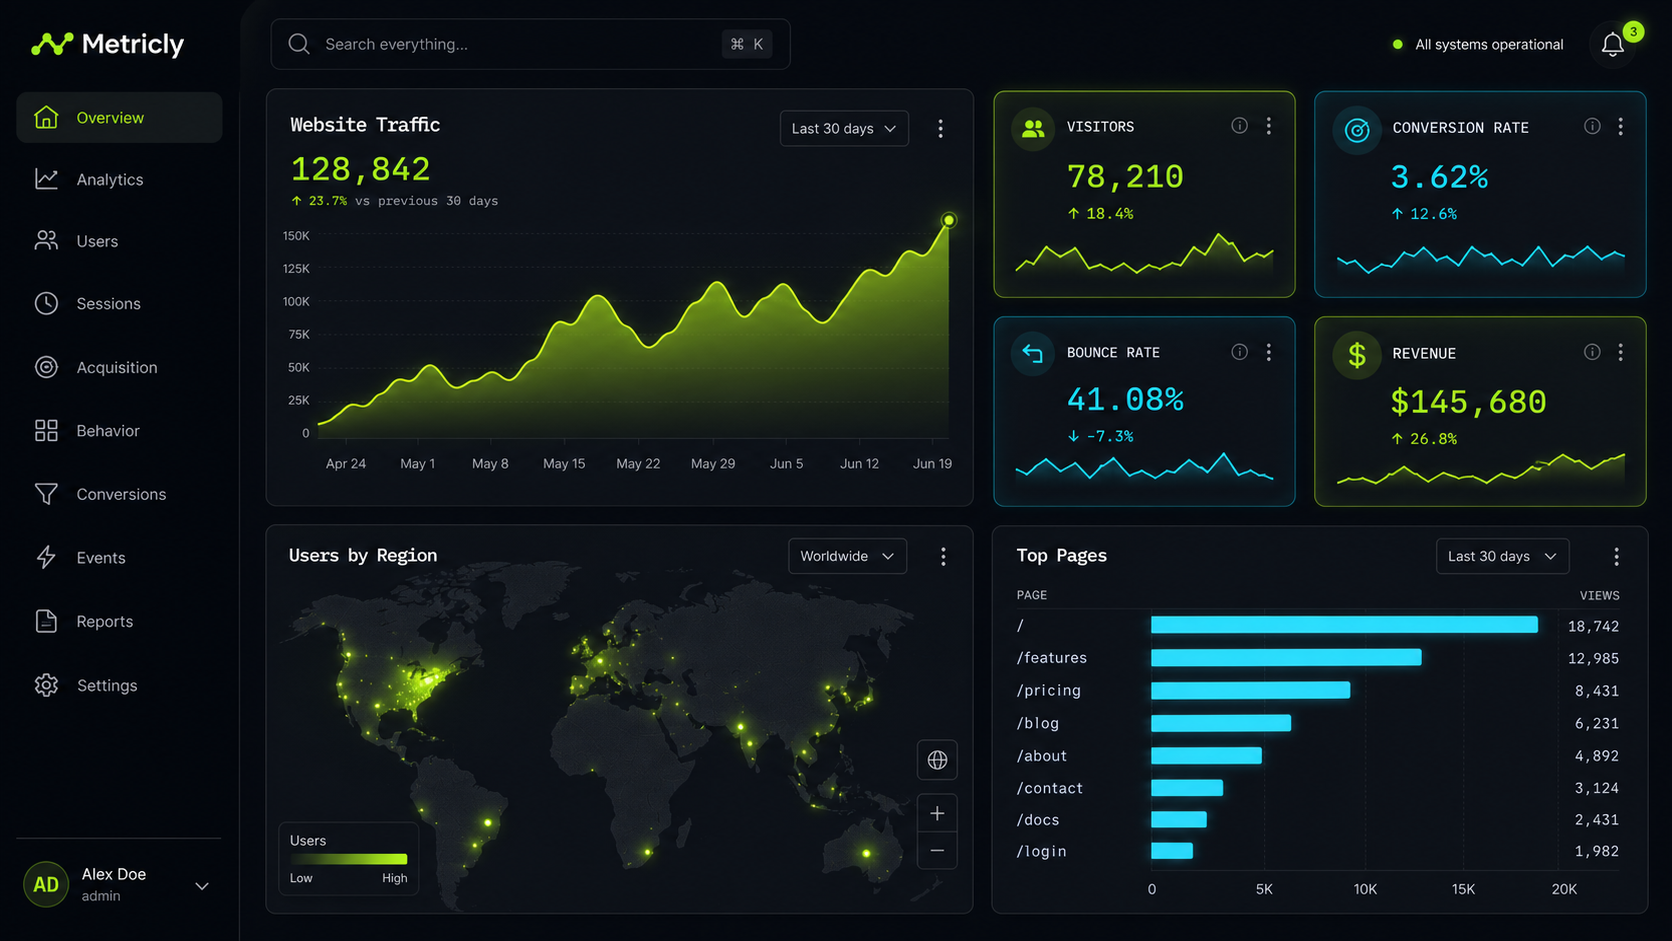
A dark-mode analytics dashboard UI mockup for a product named 'Metricly'. Left icon-rail navigation, top bar with global search and notification bell. Main grid: a large area chart of website traffic with a gradient fill, four small metric tiles (visitors, conversion, bounce rate, revenue) with tiny sparklines, a world map with glowing dots for user regions, and a bar chart of top pages. Charcoal background, neon-lime and cyan accents, glowing cards, crisp monospaced numbers, sleek modern data-viz, 16:9.使用方法
- 复制完整原始提示词,并保留其中的参数。
- 按需求替换主体、文字和构图要求。
- 在兼容的外部工具中使用,核对当前使用条件并检查结果。
开始前需了解
- 先确认是否需要参考图。标注兼容模型,不代表该示例由这个模型生成。
- 核对名称、数字与画面文字;不同模型版本的结果可能不同。