
原文
GPT Image 2 · en
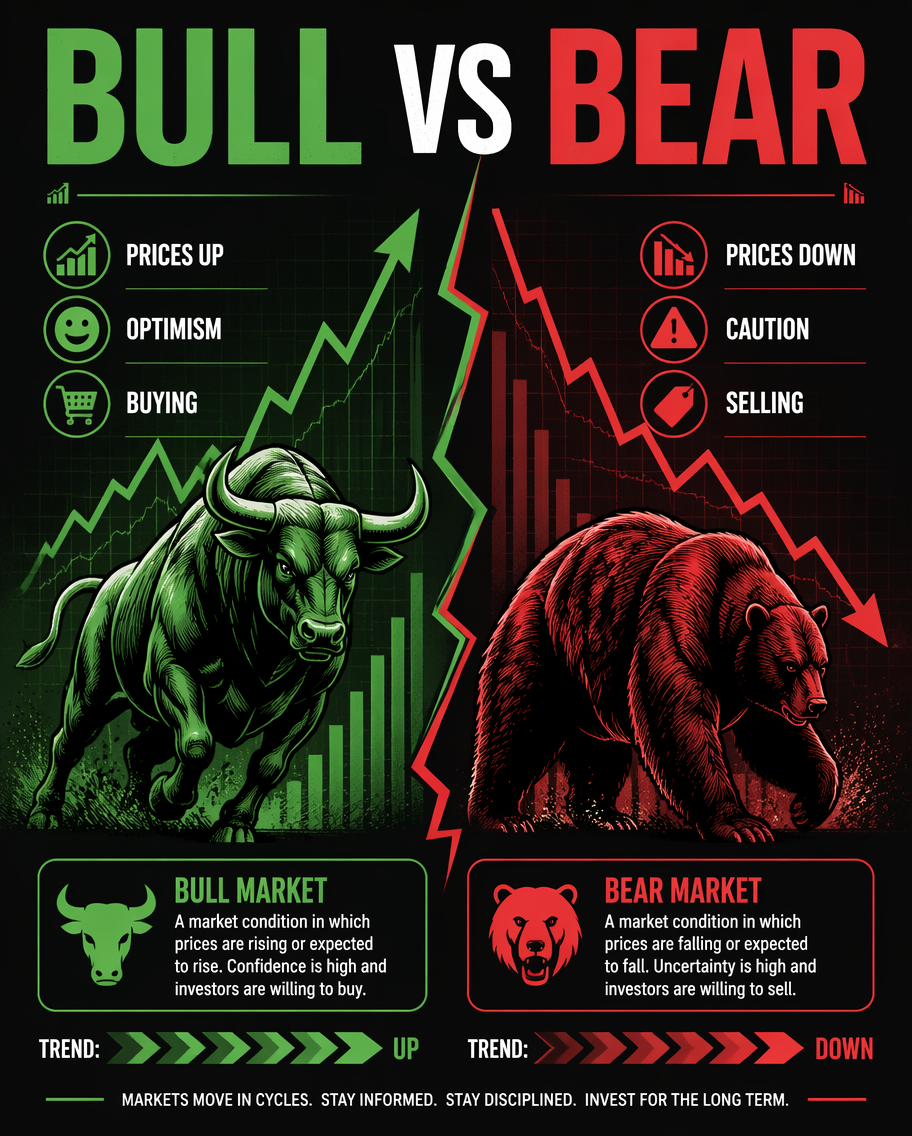
A finance-literacy infographic contrasting bull and bear markets side by side. The left half, in green, shows a charging bull with a rising line graph and the words 'prices up', 'optimism', 'buying'; the right half, in red, shows a bear with a falling graph and 'prices down', 'caution', 'selling'. A dividing zig-zag line separates the two moods. Bold flat illustration, a confident green-and-red palette on charcoal, clean data-line accents. Strong uppercase title 'Bull vs Bear' at the top, small definition cards and an arrow legend beneath each animal.使い方
- パラメータを含む元のプロンプト全体をコピーします。
- 被写体、文字、構図を自分の要件に置き換えます。
- 対応する外部ツールで使用し、利用条件と結果を確認します。
開始前の確認
- 参考画像の要否を確認してください。互換モデルの表示は、そのモデルでの生成実績を意味しません。
- 名前、数値、画像内の文字を確認します。モデルの版で結果は変わります。