
Original document
GPT Image 2 · en
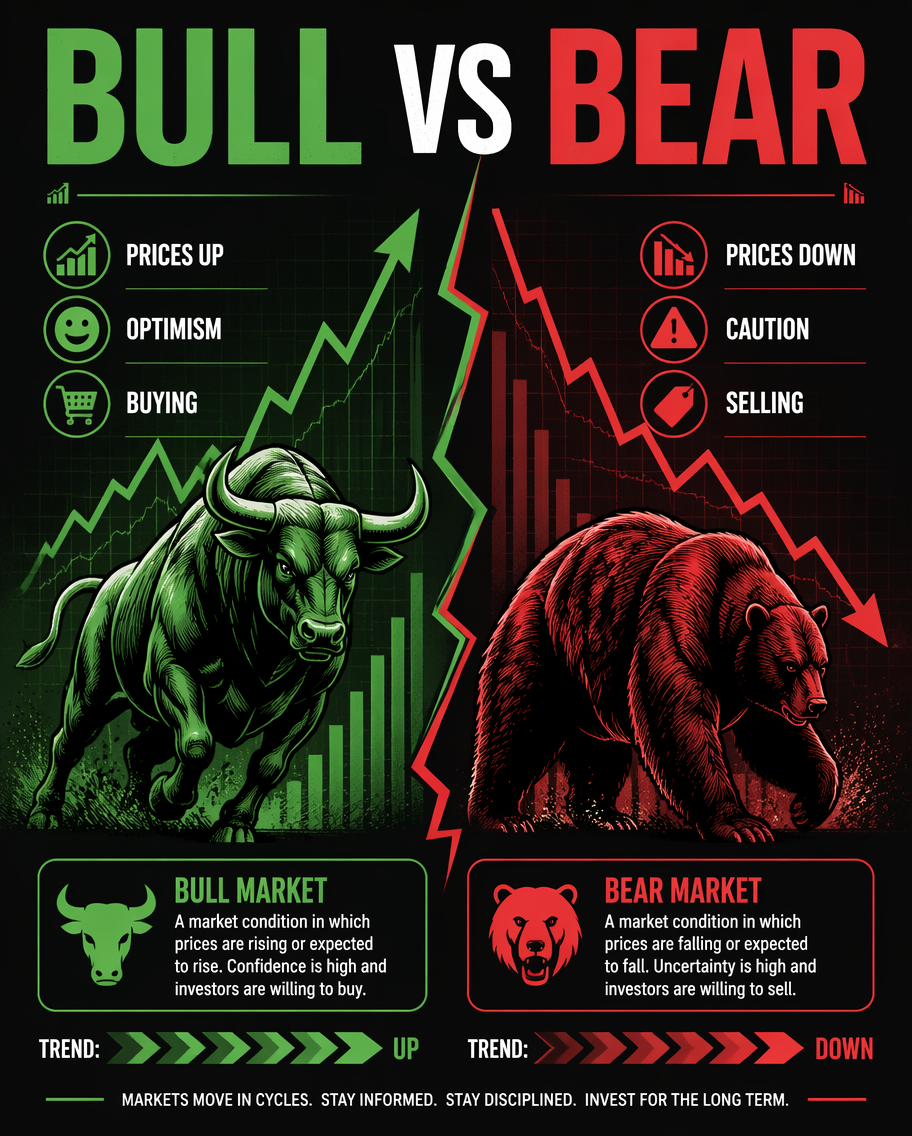
A finance-literacy infographic contrasting bull and bear markets side by side. The left half, in green, shows a charging bull with a rising line graph and the words 'prices up', 'optimism', 'buying'; the right half, in red, shows a bear with a falling graph and 'prices down', 'caution', 'selling'. A dividing zig-zag line separates the two moods. Bold flat illustration, a confident green-and-red palette on charcoal, clean data-line accents. Strong uppercase title 'Bull vs Bear' at the top, small definition cards and an arrow legend beneath each animal.How to use
- Copy the complete original prompt, including any parameters.
- Replace the subject, text and composition with your own requirements.
- Use a compatible external tool; check its current access conditions and review the result.
Before you start
- Check whether a reference image is required. A compatible model label does not mean this example was generated with that model.
- Keep names, figures and visible text accurate; results can vary between model versions.