
原文
GPT Image 2 · en
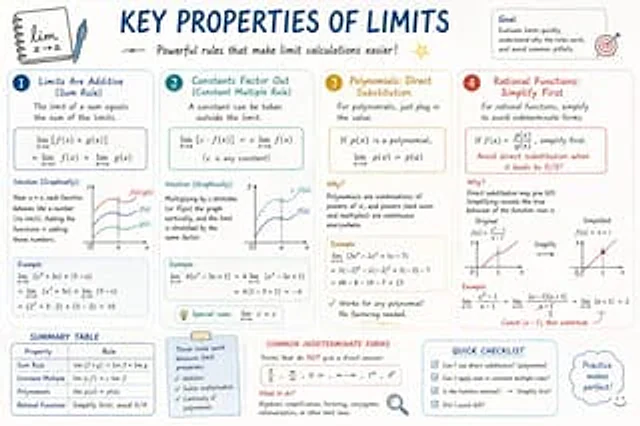
Please create a mathematical visualization infographic about "[math concept / topic]." The goal is to help the viewer intuitively understand what it is, why it works, its geometric or structural intuition, and how it behaves in different contexts. The visual should feel like a high-quality math lecture handout combined with a hand-drawn educational poster. It should be elegant, clear, and information-rich, but not cluttered. Visual style: either portrait or landscape is fine. Use a clean, light paper-like background, with a deep blue title and black or dark gray lines for the main content. Add a small number of refined accent colors such as blue, teal, gold, and red. Incorporate rounded-corner cards, thin borders, numbered labels, hand-drawn arrows, zoom-in callout boxes, and a summary section. The overall design should be aesthetically pleasing, balanced, and academic, allowing the viewer to grasp the structure of the concept and why it works at a glance.使い方
- パラメータを含む元のプロンプト全体をコピーします。
- 被写体、文字、構図を自分の要件に置き換えます。
- 対応する外部ツールで使用し、利用条件と結果を確認します。
開始前の確認
- 参考画像の要否を確認してください。互換モデルの表示は、そのモデルでの生成実績を意味しません。
- 名前、数値、画像内の文字を確認します。モデルの版で結果は変わります。