
원본 문서
GPT Image 2 · en
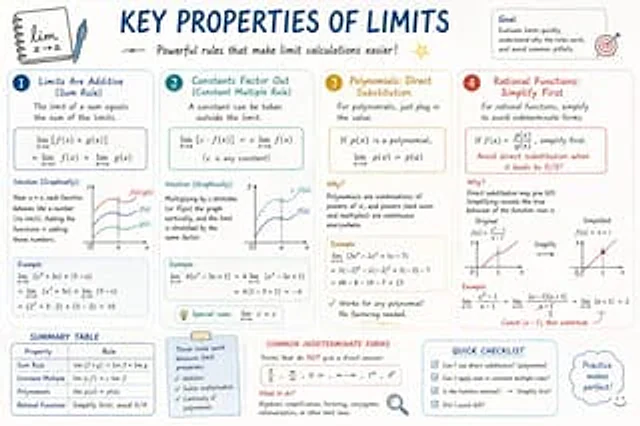
Please create a mathematical visualization infographic about "[math concept / topic]." The goal is to help the viewer intuitively understand what it is, why it works, its geometric or structural intuition, and how it behaves in different contexts. The visual should feel like a high-quality math lecture handout combined with a hand-drawn educational poster. It should be elegant, clear, and information-rich, but not cluttered. Visual style: either portrait or landscape is fine. Use a clean, light paper-like background, with a deep blue title and black or dark gray lines for the main content. Add a small number of refined accent colors such as blue, teal, gold, and red. Incorporate rounded-corner cards, thin borders, numbered labels, hand-drawn arrows, zoom-in callout boxes, and a summary section. The overall design should be aesthetically pleasing, balanced, and academic, allowing the viewer to grasp the structure of the concept and why it works at a glance.사용 방법
- 매개변수를 포함한 전체 원본 프롬프트를 복사하세요.
- 주제, 문구, 구도를 자신의 요구에 맞게 바꾸세요.
- 호환되는 외부 도구에서 사용하고 이용 조건과 결과를 확인하세요.
시작 전 확인
- 참조 이미지가 필요한지 확인하세요. 호환 표시는 해당 모델로 이 예시를 생성했다는 뜻이 아닙니다.
- 이름, 수치, 이미지 속 문구를 확인하세요. 모델 버전에 따라 결과가 다를 수 있습니다.