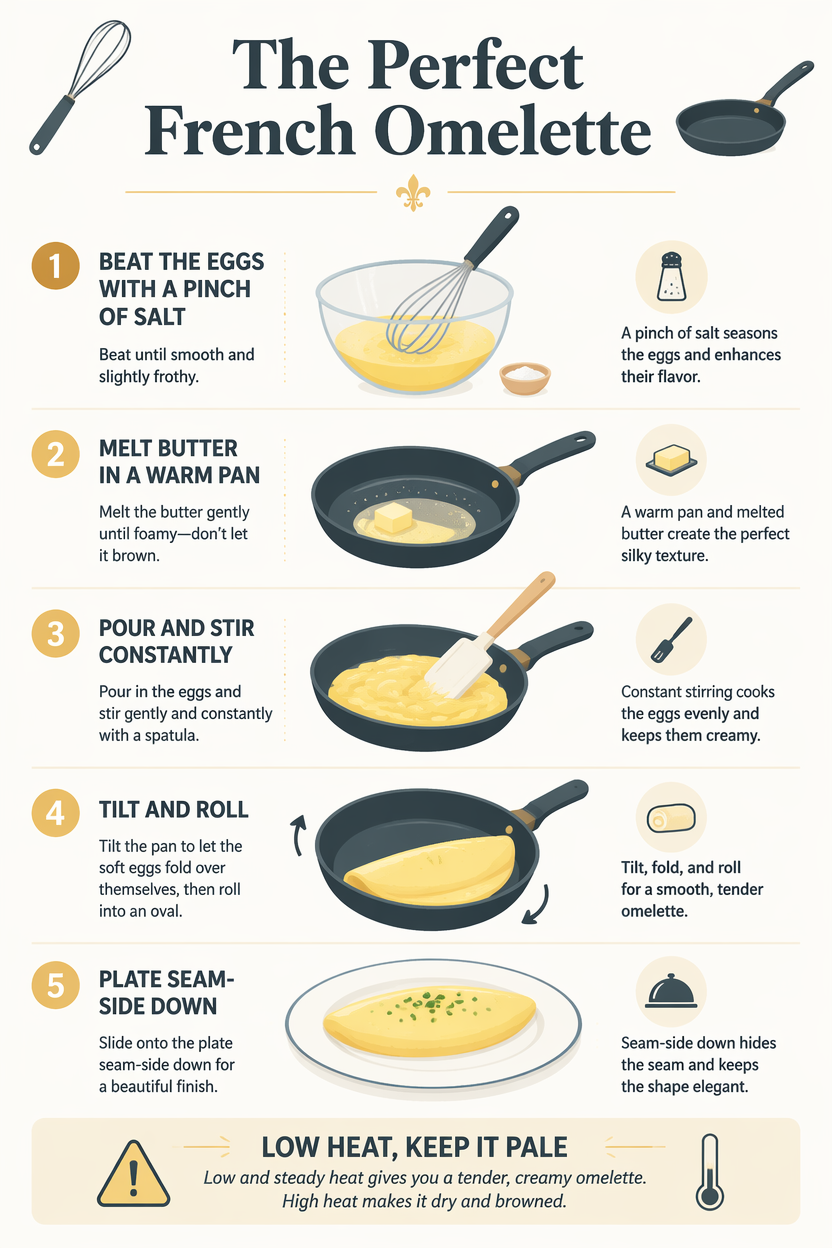
The Perfect French Omelette

The Perfect French Omelette

Oryginalny dokument

GPT Image 2 · en

A cooking infographic teaching the classic French omelette as a numbered 5-step sequence. Steps - beat the eggs with a pinch of salt, melt butter in a warm pan, pour and stir constantly, tilt and roll, plate seam-side down - each carry a clean side-view illustration and a short technique tip. A soft culinary palette of butter-yellow, cream and slate on off-white, elegant flat vector style. Bold title 'The Perfect French Omelette' at the top, small pan and whisk icons, a 'low heat, keep it pale' caution note.

Jak używać

  1. Skopiuj cały oryginalny prompt wraz z parametrami.
  2. Dostosuj temat, tekst i kompozycję do swoich potrzeb.
  3. Użyj zgodnego narzędzia zewnętrznego; sprawdź warunki dostępu i wynik.

Przed rozpoczęciem

  • Sprawdź, czy potrzebny jest obraz referencyjny. Zgodność nie potwierdza modelu użytego do przykładu.
  • Sprawdź nazwy, liczby i napisy; wyniki zależą od wersji modelu.
Podobne przykłady

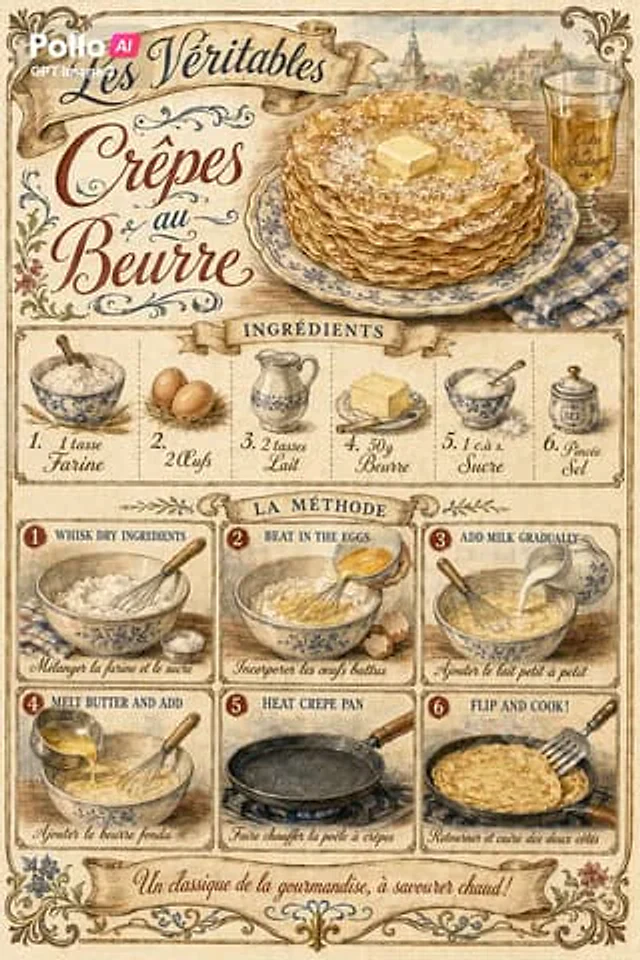
Vintage French Crepe Recipe Poster
GPT Image 2en

{ "type": "Retro French recipe poster", "subject": "Classic Butter Crepes: Gorgeous Illustrations and Food Infographics", "style": { "overall": "Antique cookbook posters, in the style of a French café from the Belle Époque, with hand-painted watercolor and ink illustrat

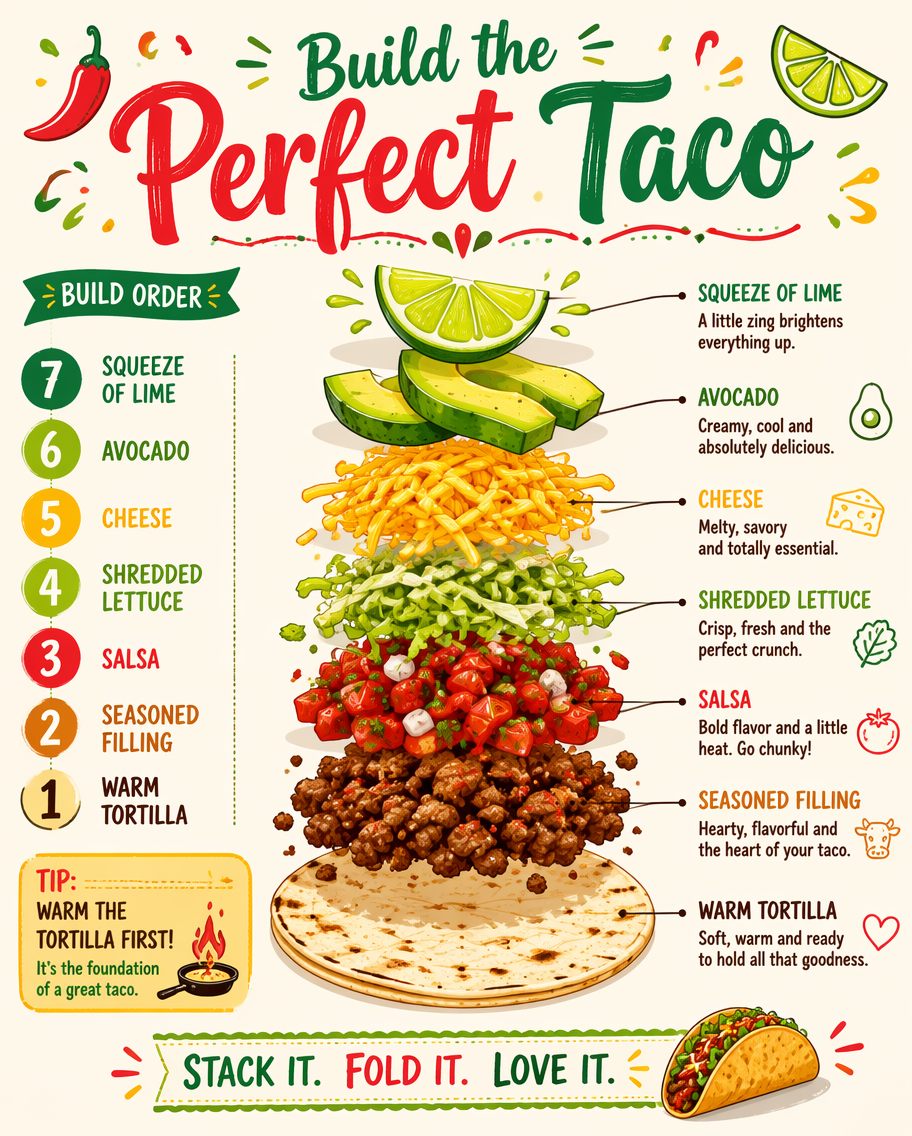
Build the Perfect Taco
GPT Image 2en

A cooking infographic showing how to build the perfect taco, drawn as an exploded stack of labeled layers plus a numbered assembly order. From a warm tortilla up through seasoned filling, salsa, shredded lettuce, cheese, avocado and a squeeze of lime, each layer has a leader line

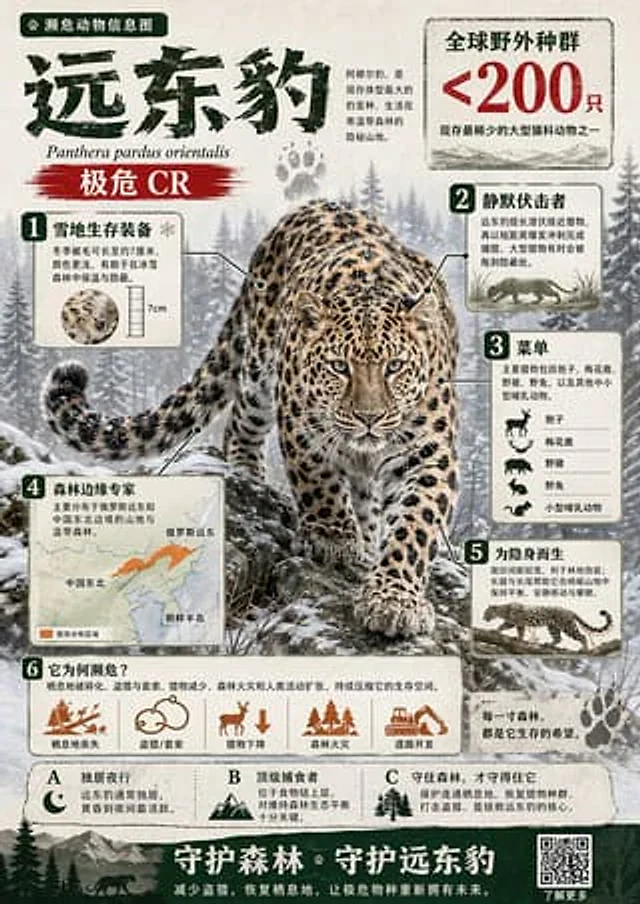
Bill The Investor #278
GPT Image 2zh

Create a visually rich infographic in Chinese about an endangered animal. Start by finding one online, research its habitat, diet, and unique traits. Present information through annotated visuals and structured callouts, not generic sections. Style it like a bold graphic illustra

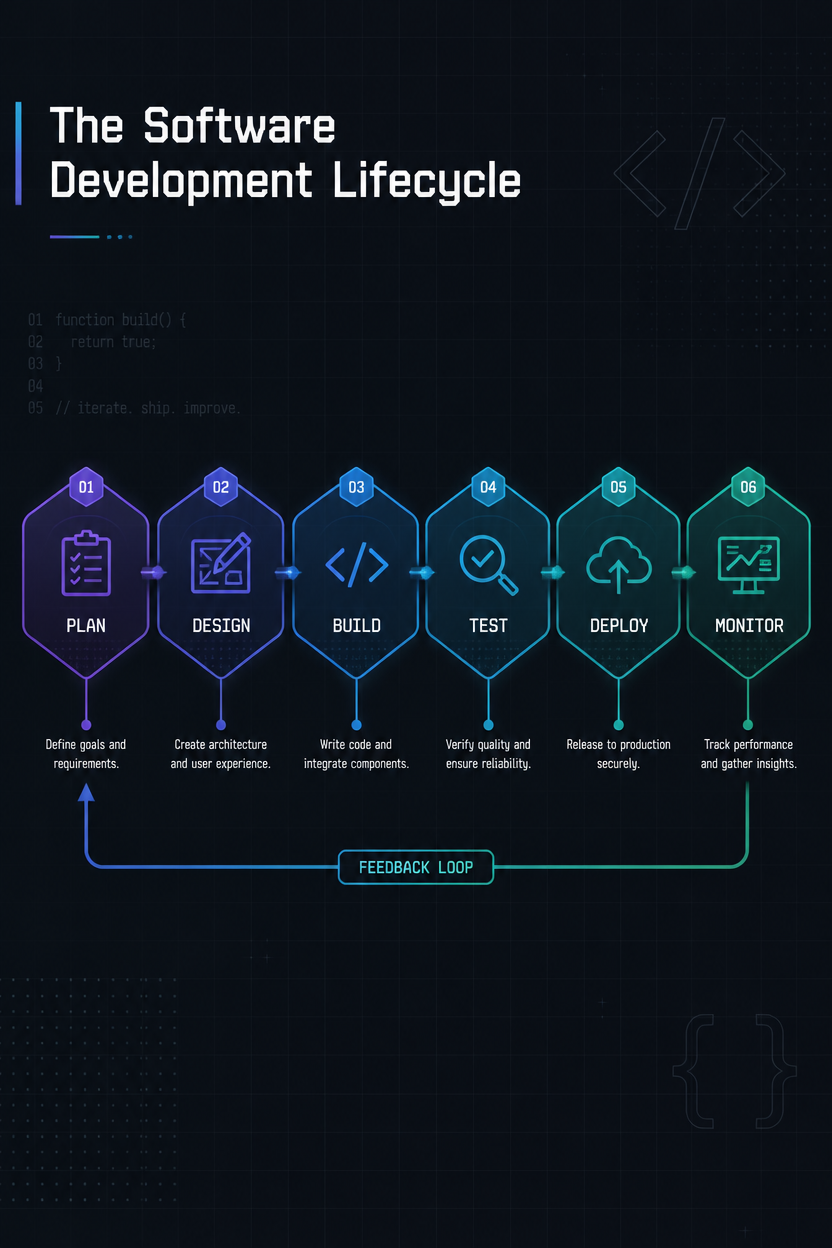
The Software Development Lifecycle
GPT Image 2en

A tech process infographic of the software development lifecycle shown as a horizontal pipeline. Stages - plan, design, build, test, deploy, monitor - appear as connected hexagonal nodes with matching icons and a one-line goal each, plus a feedback arrow looping from monitor back

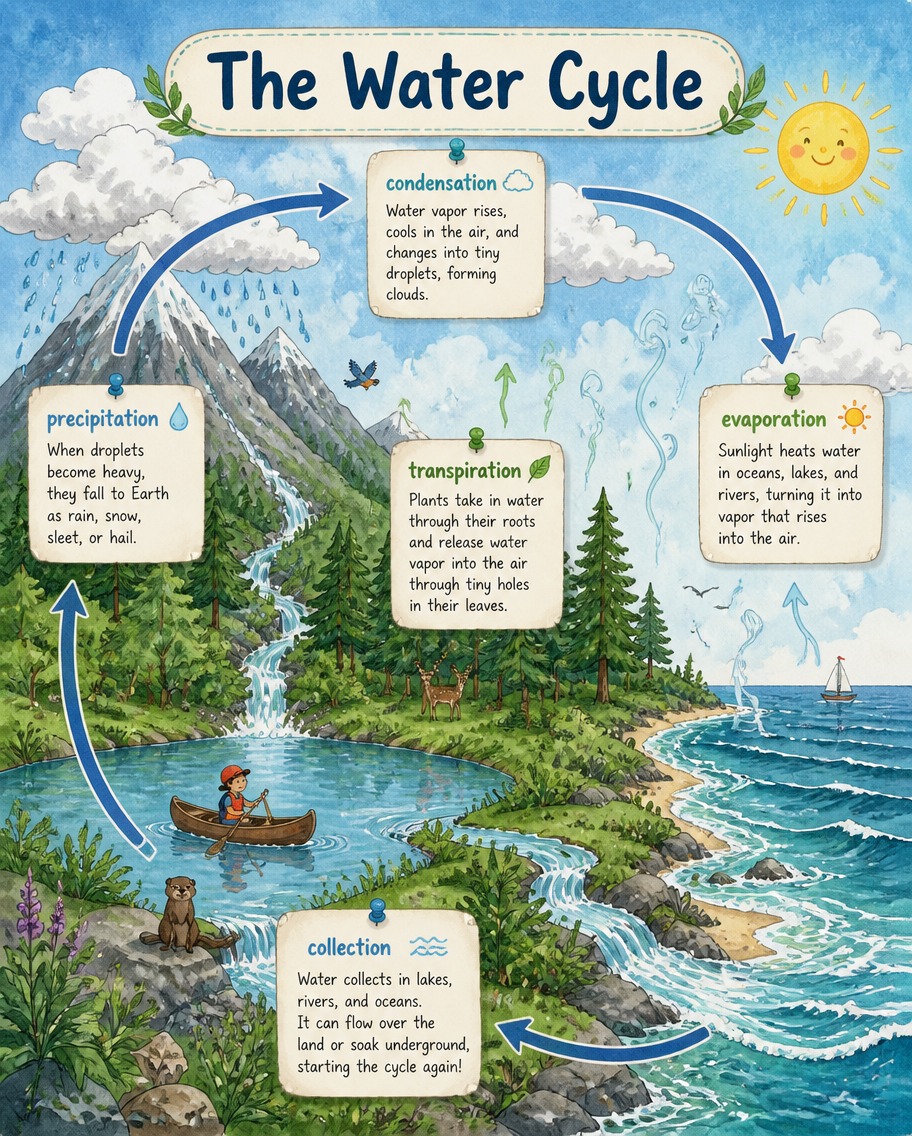
The Water Cycle
GPT Image 2en

An earth-science infographic of the water cycle drawn as one continuous landscape scene. A mountain, forest, lake and ocean sit under a cloud-filled sky, connected by looping arrows labeled 'evaporation', 'condensation', 'precipitation', 'collection' and 'transpiration'. Tiny sun

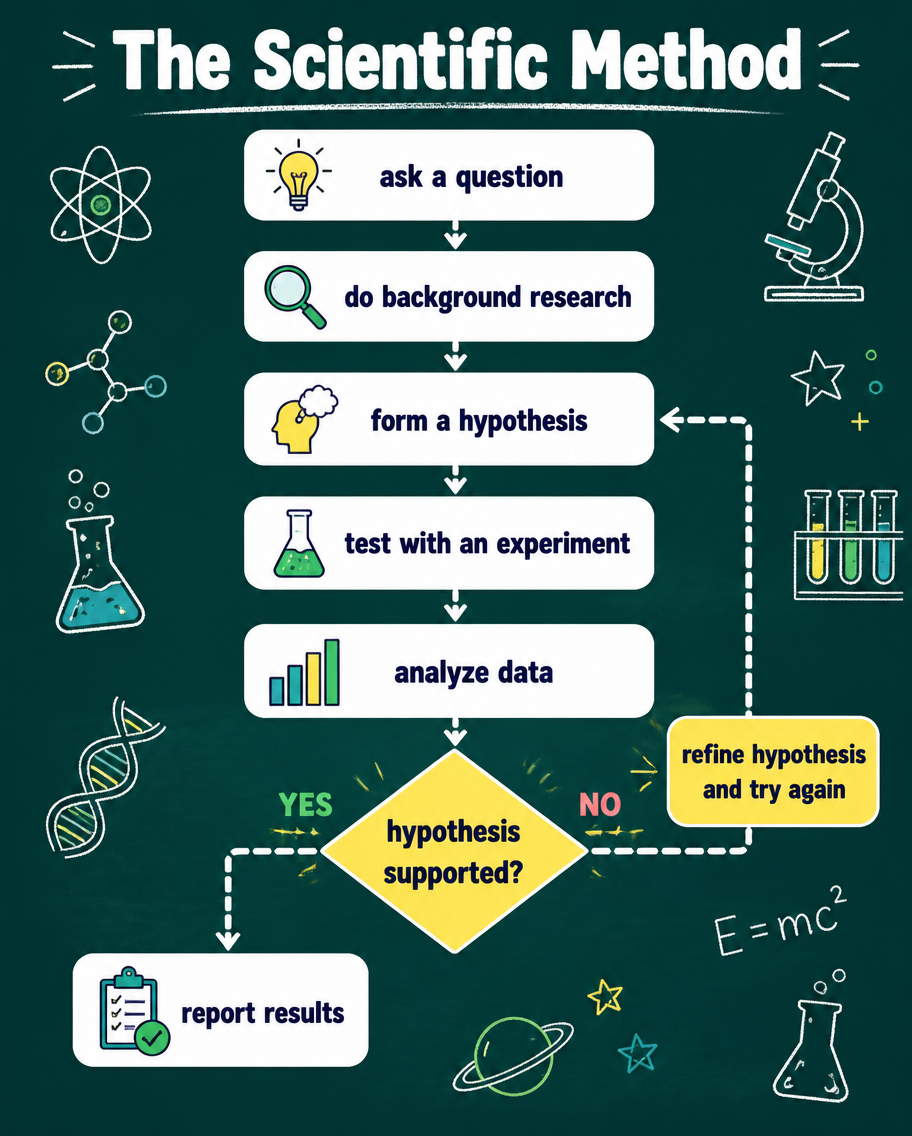
The Scientific Method
GPT Image 2en

An education flowchart infographic of the scientific method drawn as a top-to-bottom decision diagram. Rounded boxes read 'ask a question', 'do background research', 'form a hypothesis', 'test with an experiment', 'analyze data', then a decision diamond 'hypothesis supported?' br