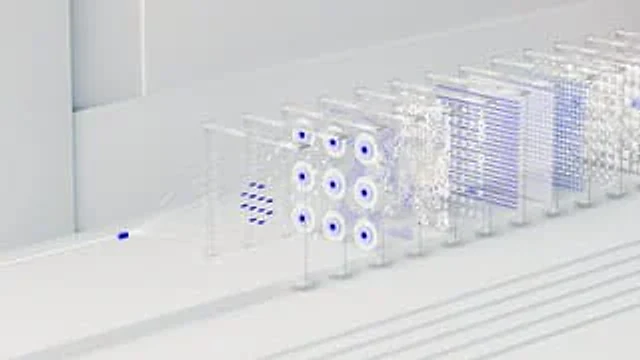
3D Abstract Data Pipeline Visualization

3D Abstract Data Pipeline Visualization

Oryginalny dokument

GPT Image 2 · en

A clean, minimalist 3D rendering that visualizes {argument name="concept" default="Neural Network Data Processing Pipeline"} On the left, a light-emitting {argument name="accent color" default="blue"} The pointed white cable branches into multiple thin, curved white bundles. These bundles converge into a linear sequence of 10 transparent, glass-like rectangular panels, which stand vertically {argument name="environment" default="sterile white stepped surface"} Above. Each glass panel uses white and {argument name="accent color" default="blue"} The geometric patterns showcase different transition stages. From left to right, the panel sequentially presents: floating short horizontal lines, a 3x3 concentric circle grid, a dense dot matrix, scattered white pixel blocks, horizontal dashed lines, a fine grid, and finally a 3D cube structure. The bright, soft, and high-key lighting creates a pure corporate technological aesthetic, while the shallow depth-of-field effect gives the panels at the farthest point a soft, blurred appearance.

Jak używać

  1. Skopiuj cały oryginalny prompt wraz z parametrami.
  2. Dostosuj temat, tekst i kompozycję do swoich potrzeb.
  3. Użyj zgodnego narzędzia zewnętrznego; sprawdź warunki dostępu i wynik.

Przed rozpoczęciem

  • Sprawdź, czy potrzebny jest obraz referencyjny. Zgodność nie potwierdza modelu użytego do przykładu.
  • Sprawdź nazwy, liczby i napisy; wyniki zależą od wersji modelu.
Podobne przykłady

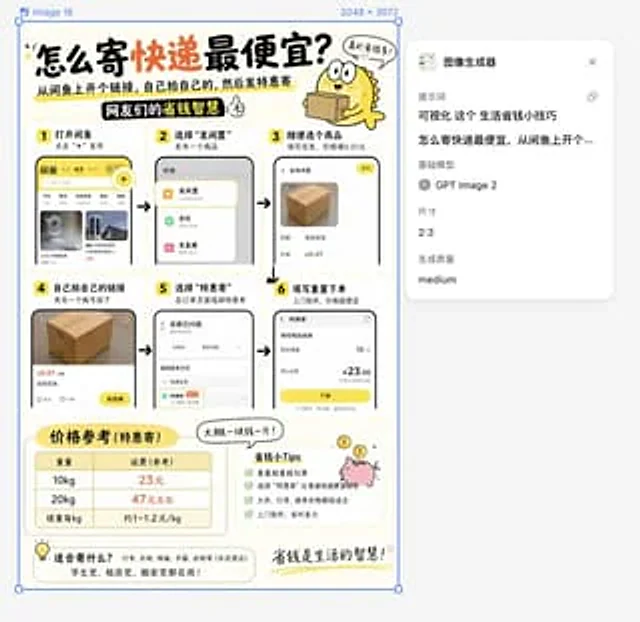
Life Hack Visualization
GPT Image 2en

Visualize this content{argument name="topic" default="Money-saving tips for daily life"}{argument name="specific tip" default="How to send a package at the cheapest price: Create a link on Xianyu (a second-hand marketplace), place the order yourself, and then use the discount for

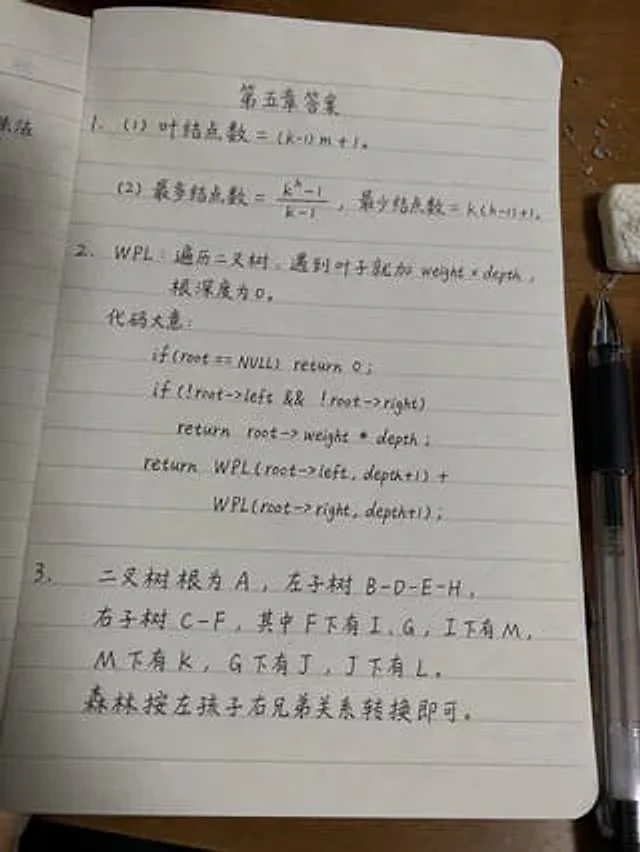
Handwritten Data Structures Homework Photo
GPT Image 2en

Goal: Create a realistic smartphone photo of a lined notebook page on a wooden desk, showing a handwritten software/data-structure homework answer sheet in slightly messy but believable black gel-pen handwriting. The page title should be centered near the top as {argument name="p

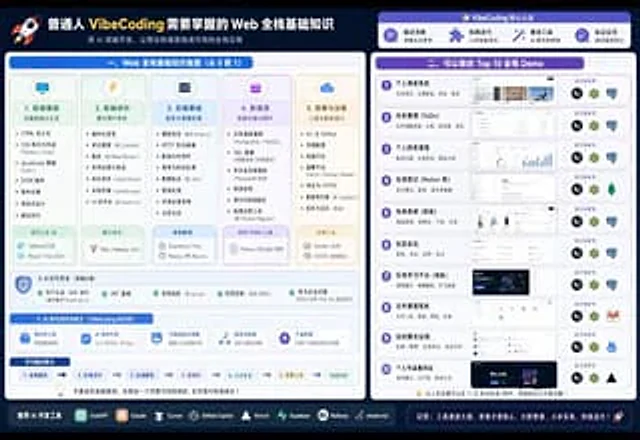
Full Stack Knowledge Visualization
GPT Image 2en

right{argument name="subject" default="Basic Web Full-Stack Knowledge Required for Ordinary People to Perform VibeCoding"} Visual presentations, and what can be created{argument name="count" default="Top 10"} Full-stack project demonstration.

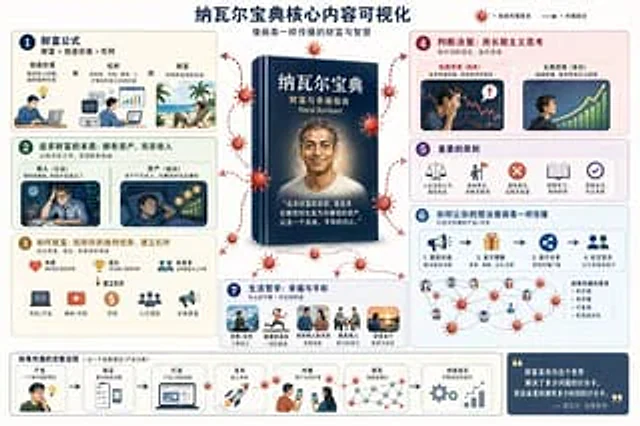
Book Visualization Prompt
GPT Image 2en

Visually demonstrate through specific scene illustrations{argument name="book name" default="The Almanack of Naval Ravikant"} The core content is incorporated with viral marketing elements suitable for social media dissemination.

Editorial Dual-Axis Data Infographic
GPT Image 2en

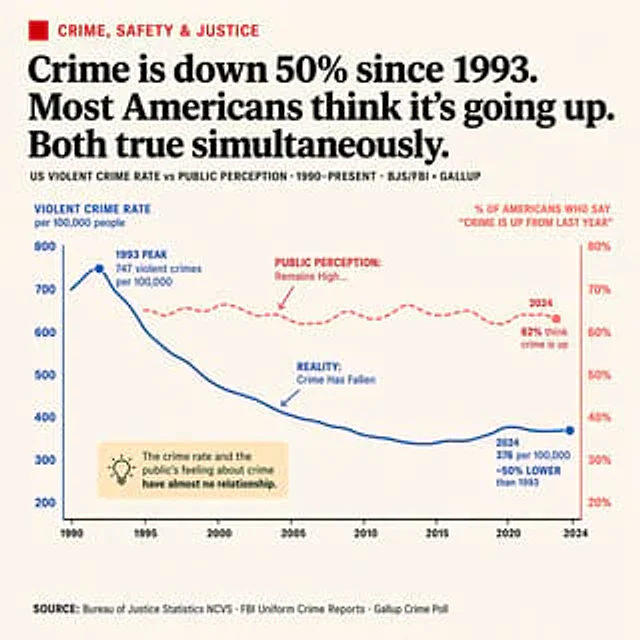
{ "type": "Editor-level infographic dual-axis line chart", "style": "Simple, newspaper-style layout with off-white background and highly readable typography.", "header": { "category": "Crime, Security, and Justice (red text with red square icons)", "headline": "{arg