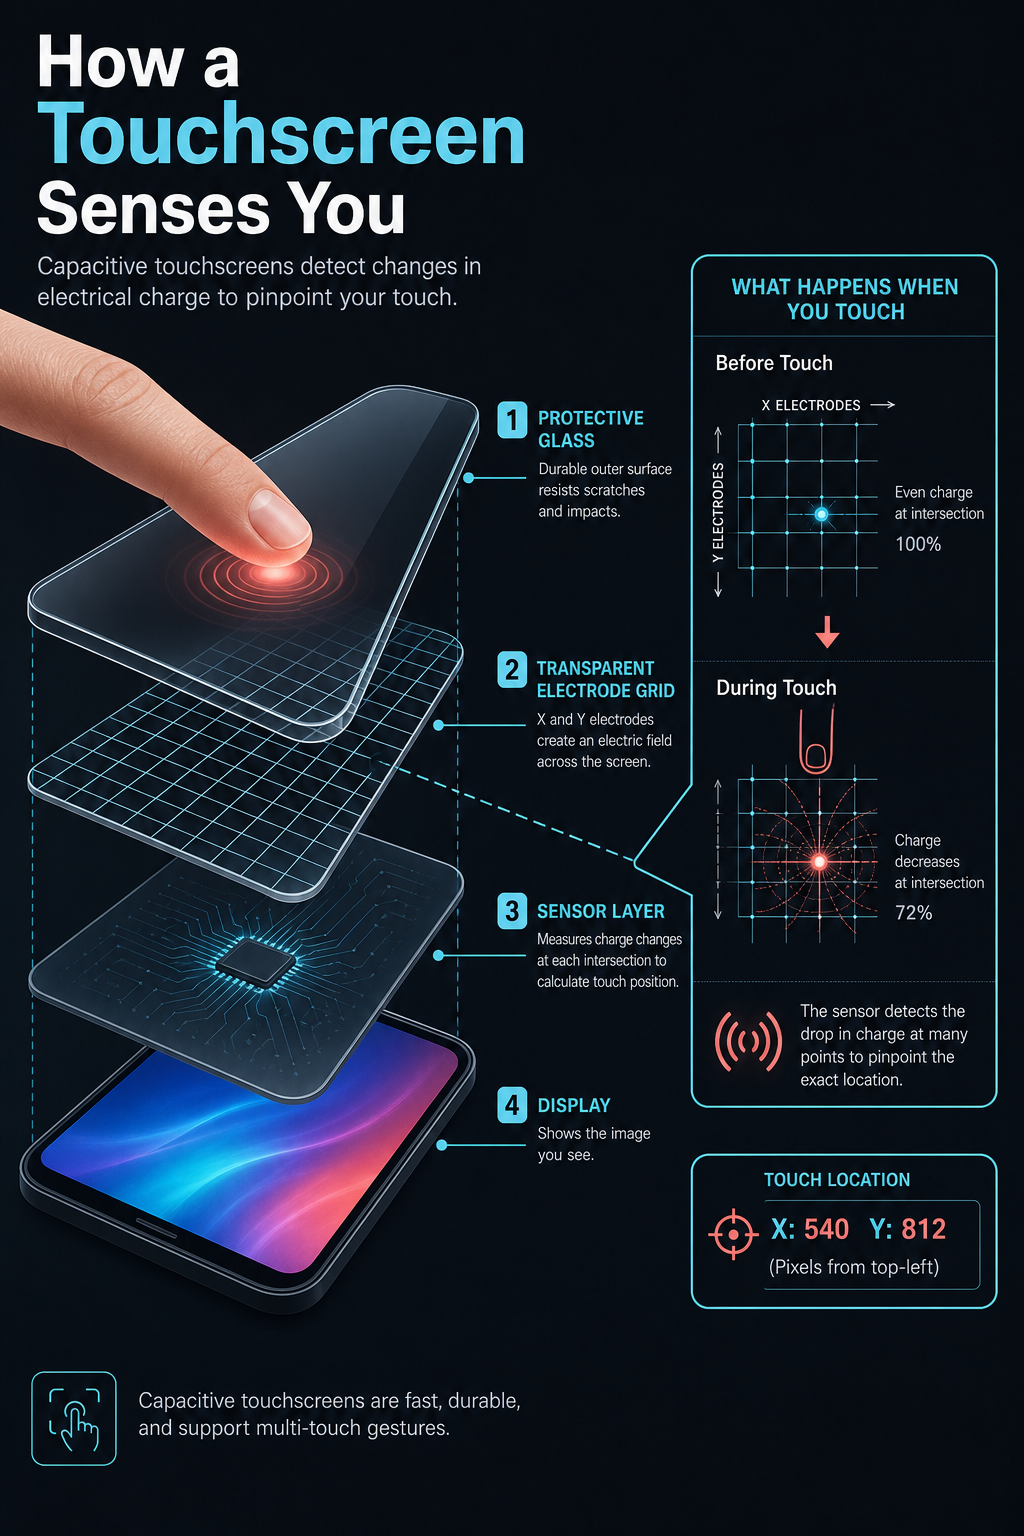
How a Touchscreen Senses You

How a Touchscreen Senses You

Oryginalny dokument

GPT Image 2 · en

A technology infographic explaining how a capacitive touchscreen works, shown as an exploded layer stack of a phone screen. Labeled layers - protective glass, a transparent electrode grid, a sensor layer, and the display - separate vertically; a fingertip touches the top, and a zoomed inset shows the electrical charge change detected at the grid. A clean tech aesthetic, a cool grey-and-cyan palette with a coral touch-point accent on dark charcoal. Bold title 'How a Touchscreen Senses You' top-left, numbered layer labels, a small grid-coordinate readout.

Jak używać

  1. Skopiuj cały oryginalny prompt wraz z parametrami.
  2. Dostosuj temat, tekst i kompozycję do swoich potrzeb.
  3. Użyj zgodnego narzędzia zewnętrznego; sprawdź warunki dostępu i wynik.

Przed rozpoczęciem

  • Sprawdź, czy potrzebny jest obraz referencyjny. Zgodność nie potwierdza modelu użytego do przykładu.
  • Sprawdź nazwy, liczby i napisy; wyniki zależą od wersji modelu.
Podobne przykłady

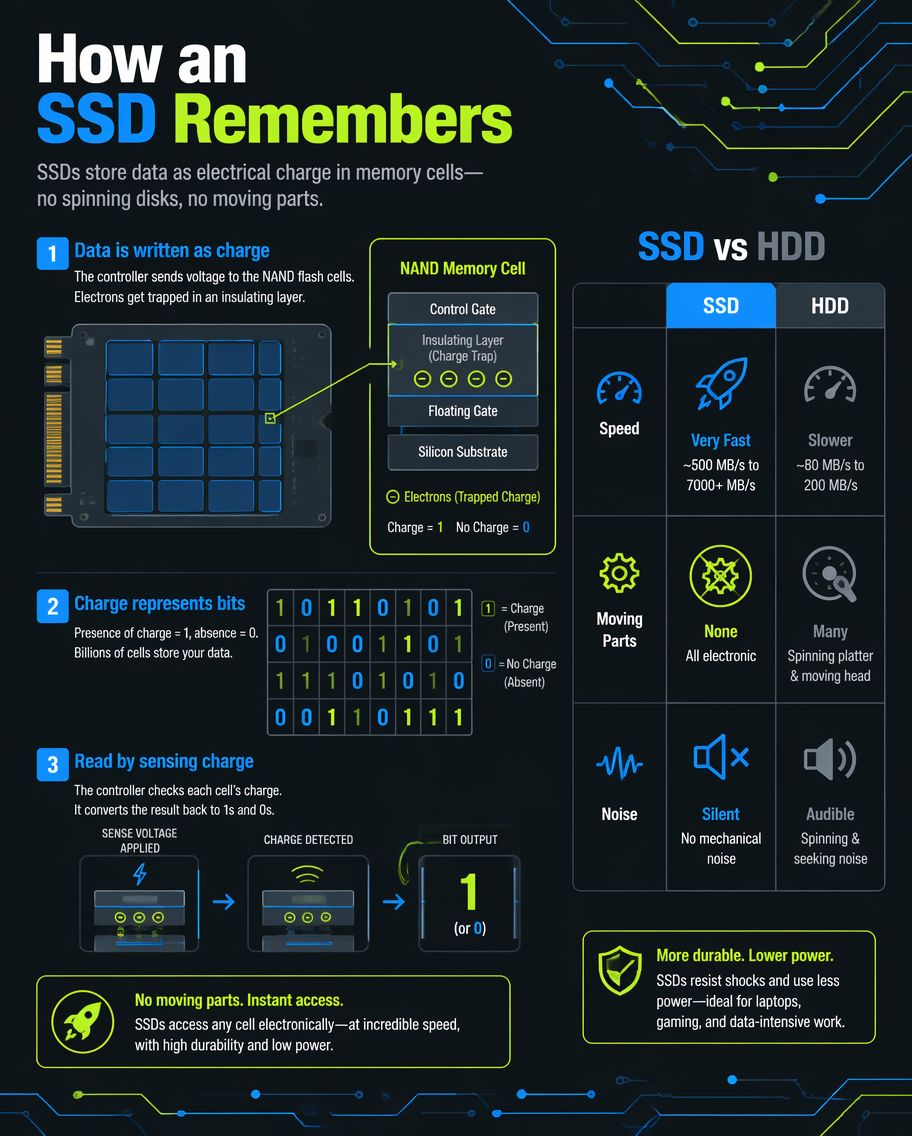
How an SSD Remembers
GPT Image 2en

A technology infographic explaining how a solid-state drive stores data, contrasting it with a spinning hard drive. Left: a stylized SSD chip grid with a zoomed inset of memory cells holding 1s and 0s as trapped charge; right: a mini comparison table of SSD vs HDD (speed, moving

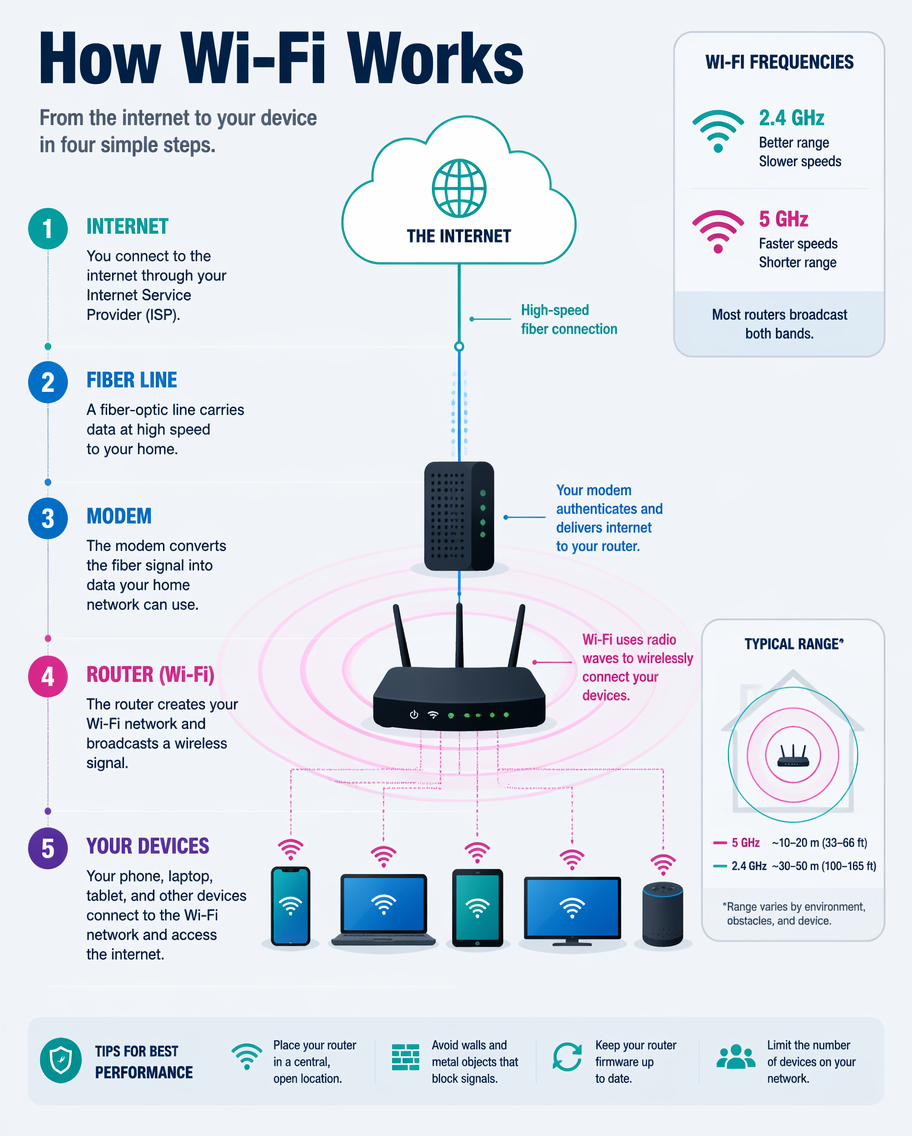
How Wi-Fi Works
GPT Image 2en

A technology infographic explaining how Wi-Fi delivers internet, shown as a layered flow from the internet cloud to a phone. Stages - a fiber line, a modem, a router broadcasting radio waves, and connecting devices - each carry an icon, with concentric signal-wave rings radiating

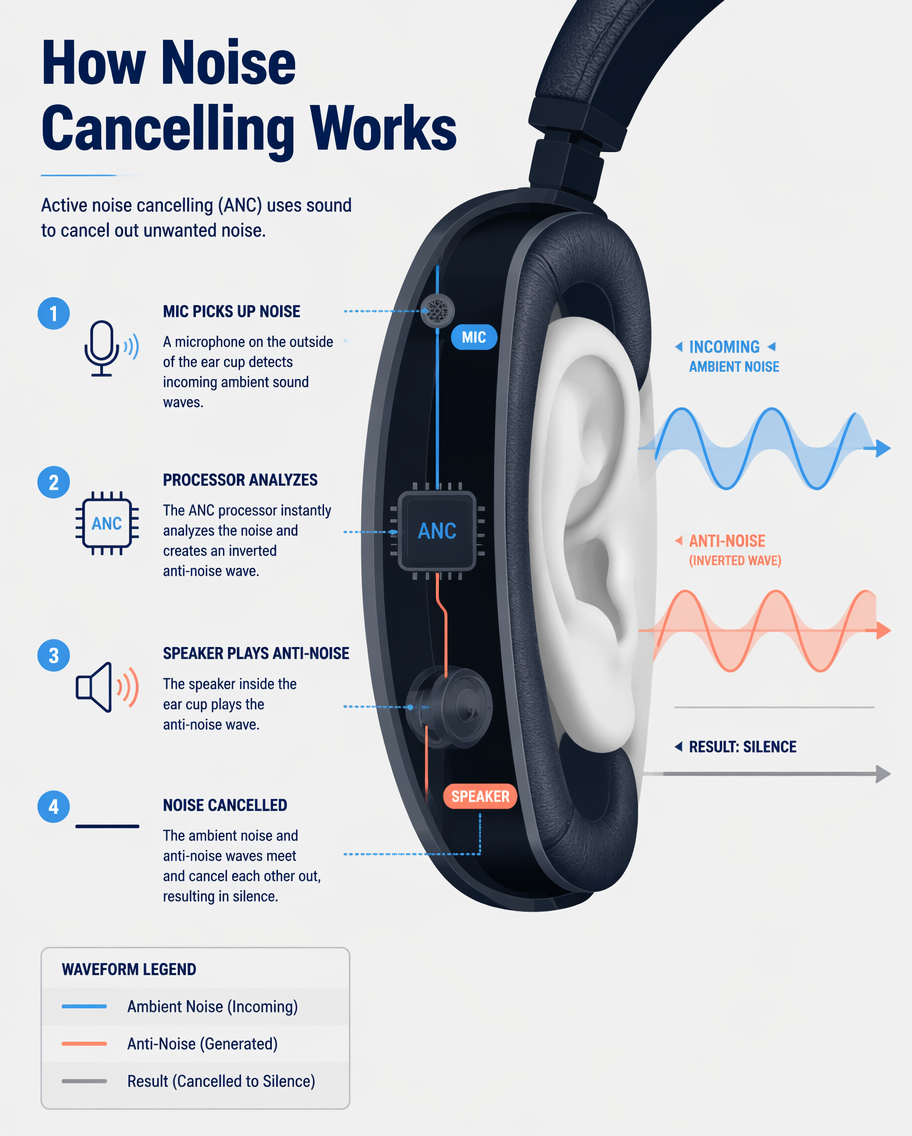
How Noise Cancelling Works
GPT Image 2en

A technology infographic explaining active noise cancelling in headphones, drawn as a cross-section of an ear cup around an ear. Incoming ambient sound waves meet an inverted 'anti-noise' wave generated by the headphone, and the two flatten to silence - shown with layered blue an

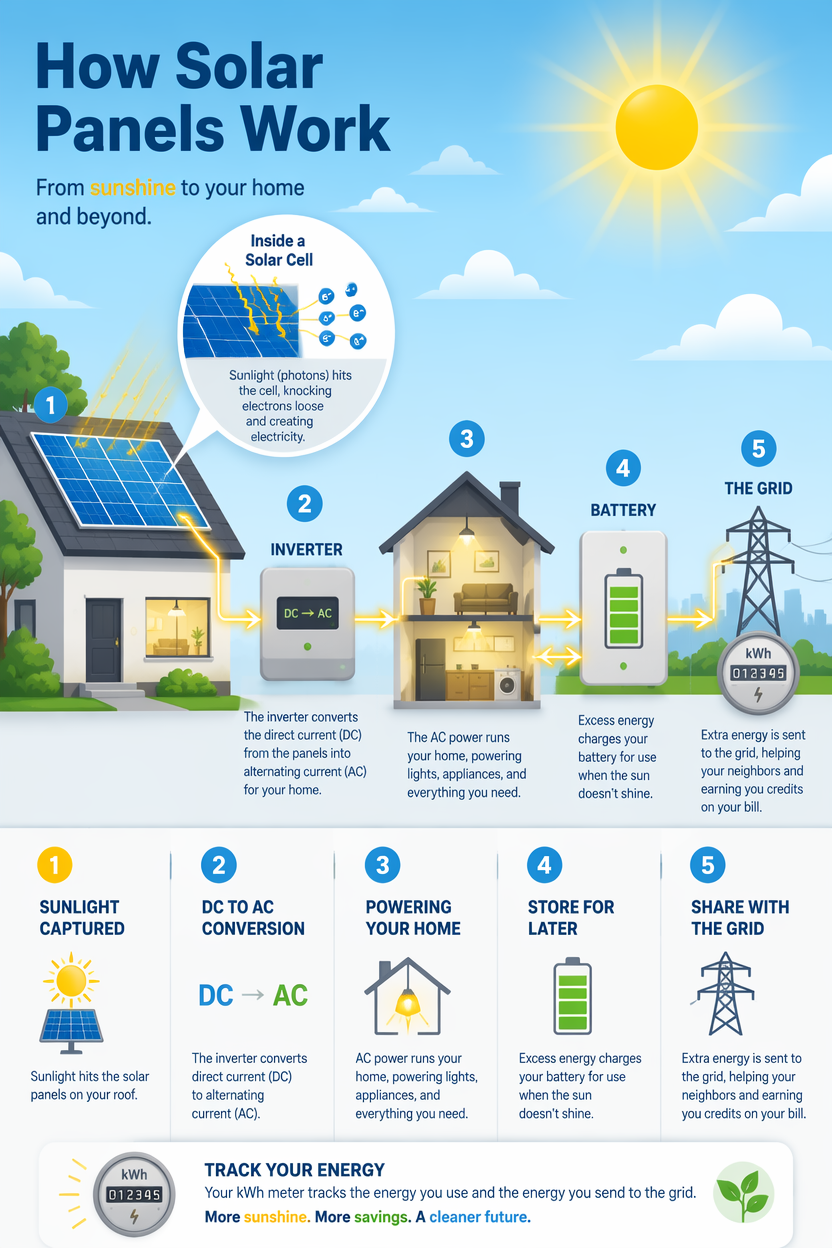
How Solar Panels Work
GPT Image 2en

A clean-tech infographic explaining how a solar panel powers a home, drawn as a left-to-right energy flow. Sunlight hits a rooftop panel (a zoomed inset shows photovoltaic cells knocking electrons loose), current runs to an inverter converting DC to AC, then to a house and a batt

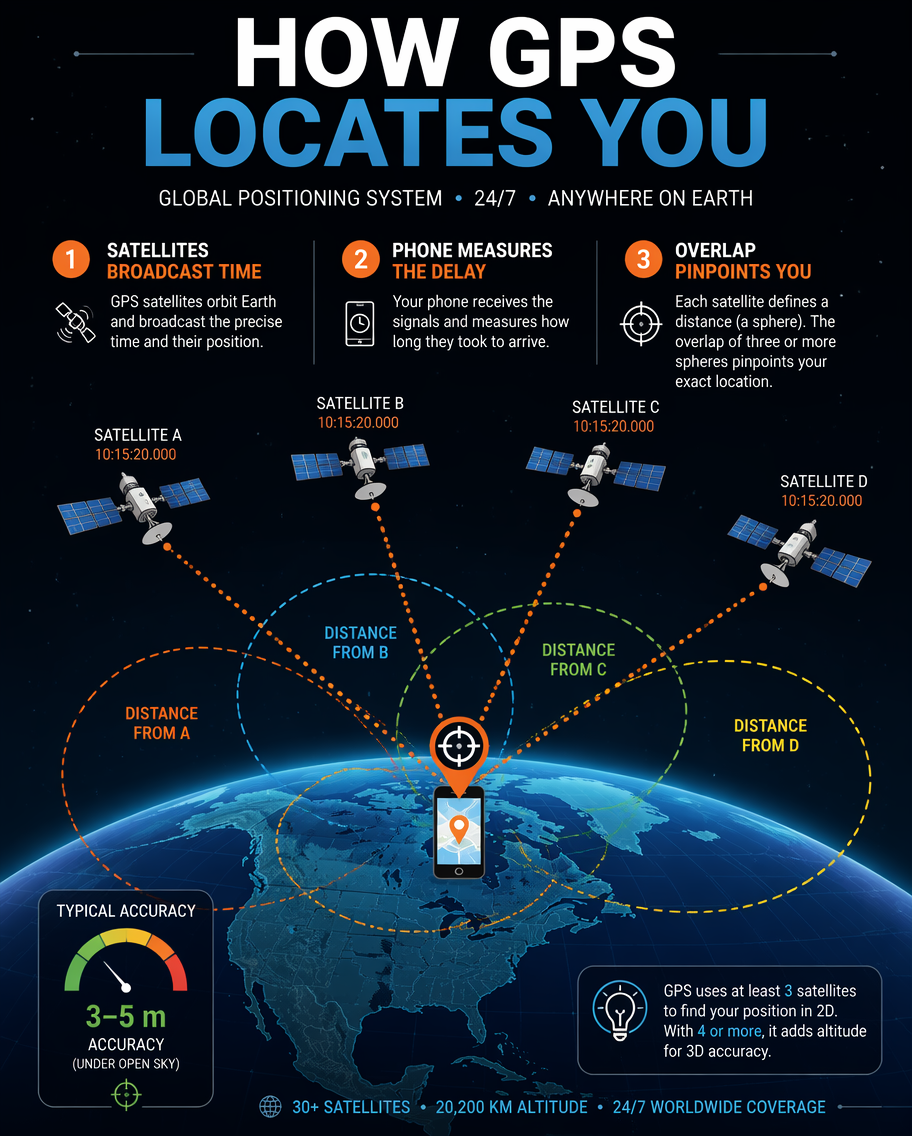
How GPS Locates You
GPT Image 2en

A technology infographic explaining how GPS finds your location, drawn as a scene with three or four satellites beaming signals down to a phone on a stylized globe. Dotted signal lines and expanding range circles illustrate trilateration; numbered captions explain 'satellites bro

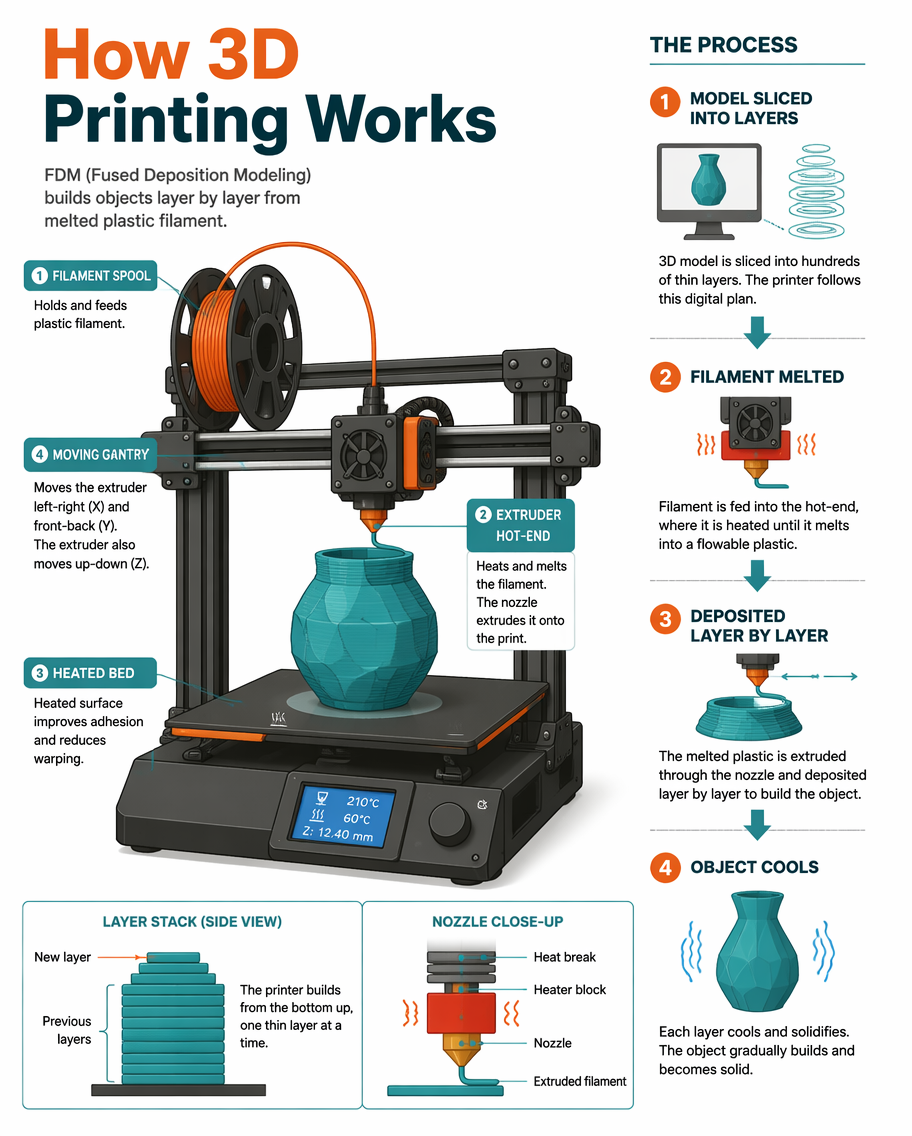
How 3D Printing Works
GPT Image 2en

A maker-tech infographic explaining how an FDM 3D printer builds an object, drawn as a labeled machine diagram with a step flow. Components - a filament spool, an extruder hot-end, a heated bed, a moving gantry - are labeled; a numbered sequence shows 'model sliced into layers',