EV Brand Market Share

EV Brand Market Share

原始文档

GPT Image 2 · en

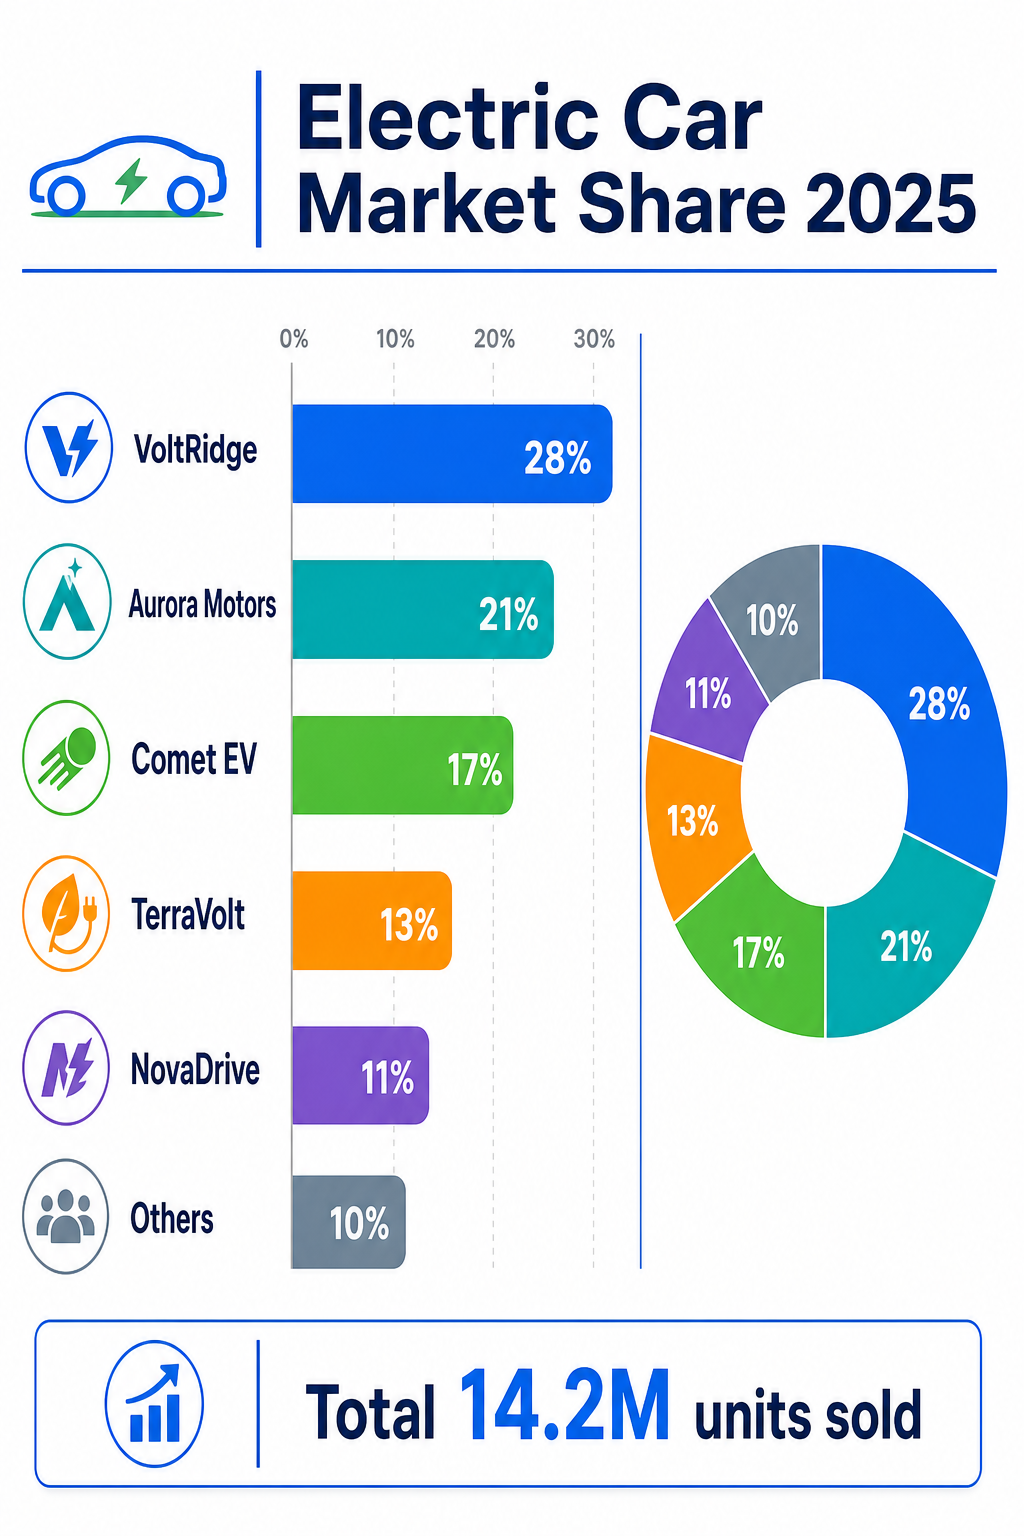
A market-share infographic, 2:3, titled 'Electric Car Market Share 2025'. A horizontal bar chart ranks invented EV makers: VoltRidge 28%, Aurora Motors 21%, Comet EV 17%, TerraVolt 13%, NovaDrive 11%, Others 10%, each bar in a distinct color with the percentage in bold. Small car-badge icons head each row. A side donut echoes the split, and a footer stat reads 'Total 14.2M units sold'. Clean flat design, electric-blue and green palette, white background, rounded bars, thin grid, modern automotive data-report aesthetic, crisp sans-serif.

使用方法

  1. 复制完整原始提示词,并保留其中的参数。
  2. 按需求替换主体、文字和构图要求。
  3. 在兼容的外部工具中使用,核对当前使用条件并检查结果。

开始前需了解

  • 先确认是否需要参考图。标注兼容模型,不代表该示例由这个模型生成。
  • 核对名称、数字与画面文字;不同模型版本的结果可能不同。

相似案例

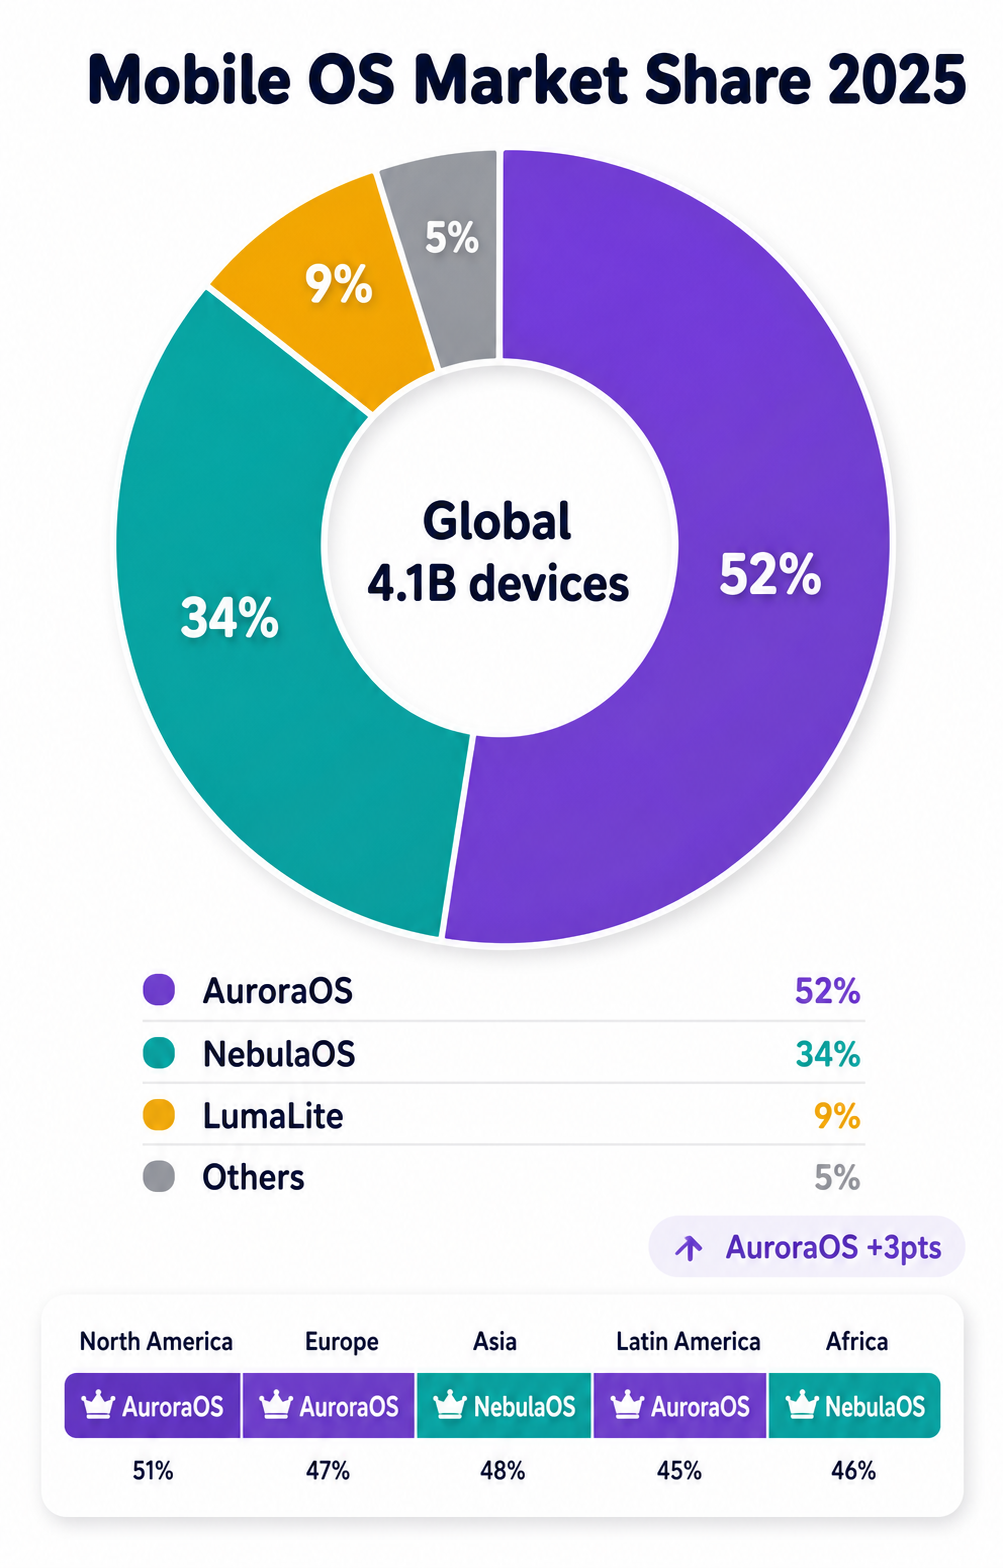
Mobile OS Market Share
GPT Image 2en

A market-share infographic, 4:5, titled 'Mobile OS Market Share 2025'. A large donut chart splits the market between invented systems: AuroraOS 52% (purple), NebulaOS 34% (teal), LumaLite 9% (amber), Others 5% (grey). The donut center reads 'Global 4.1B devices'. A legend with co

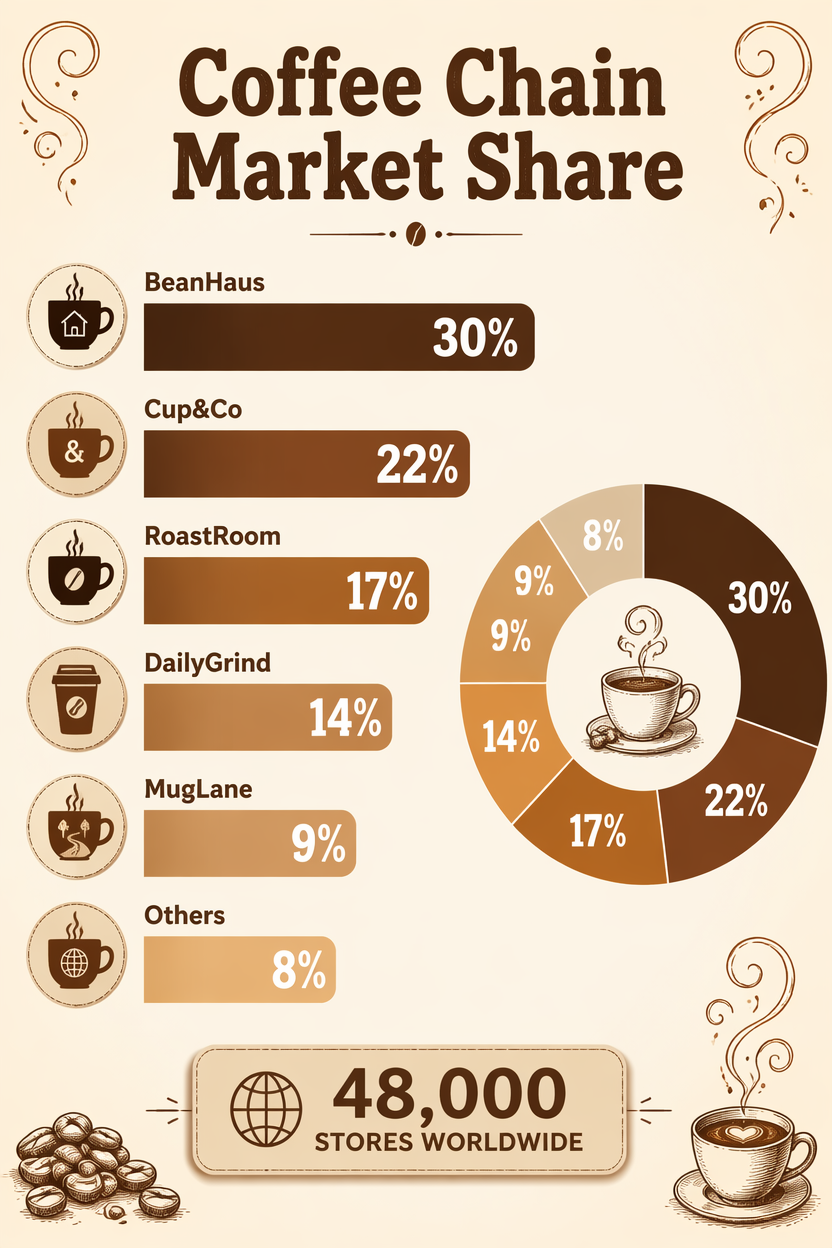
Coffee Chain Market Share
GPT Image 2en

A retail market-share infographic, 2:3, titled 'Coffee Chain Market Share'. A horizontal bar ranking of invented chains: BeanHaus 30%, Cup&Co 22%, RoastRoom 17%, DailyGrind 14%, MugLane 9%, Others 8%, each bar in a warm brown-to-caramel gradient with bold percentages. Small coffe

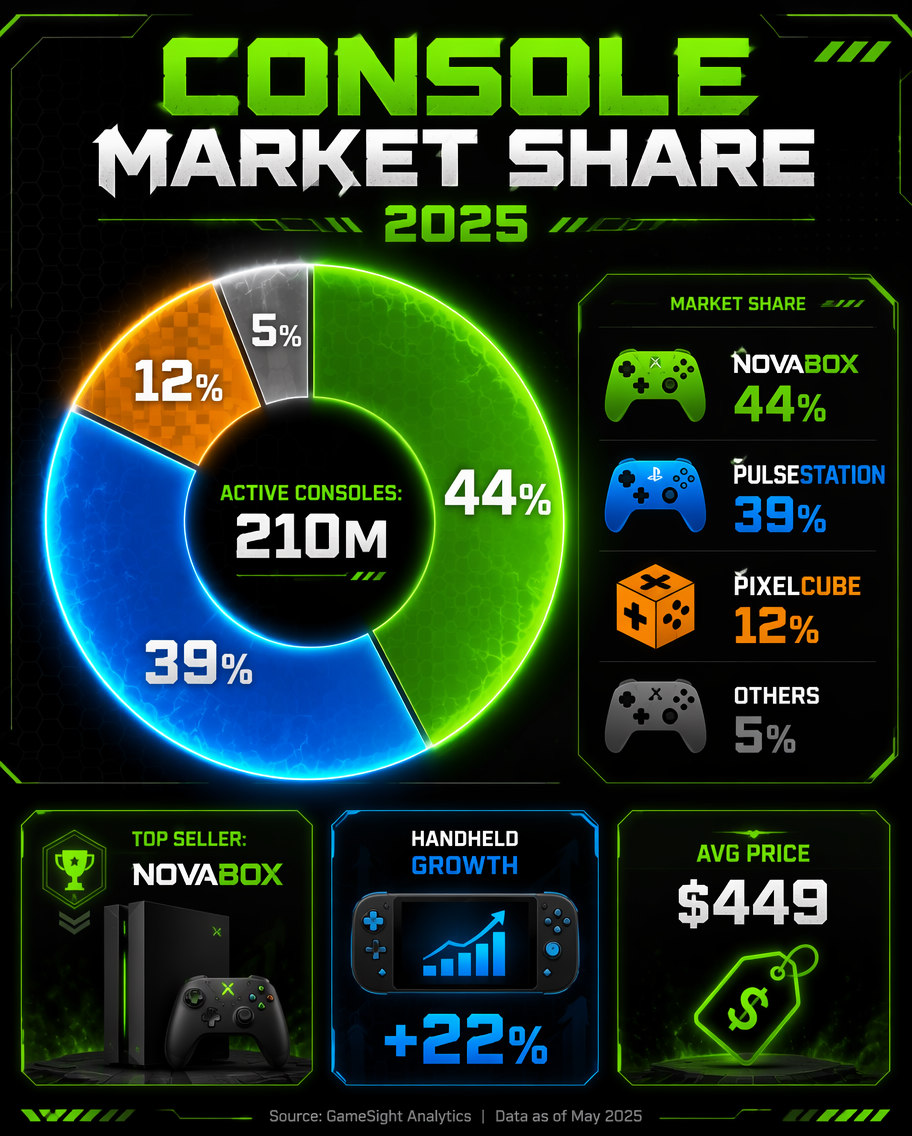
Gaming Console Share
GPT Image 2en

A gaming market-share infographic, 4:5, titled 'Console Market Share 2025'. A donut chart splits invented consoles: NovaBox 44% (green), PulseStation 39% (blue), PixelCube 12% (orange), Others 5% (grey). Center label 'Active consoles: 210M'. A legend with controller-shaped color

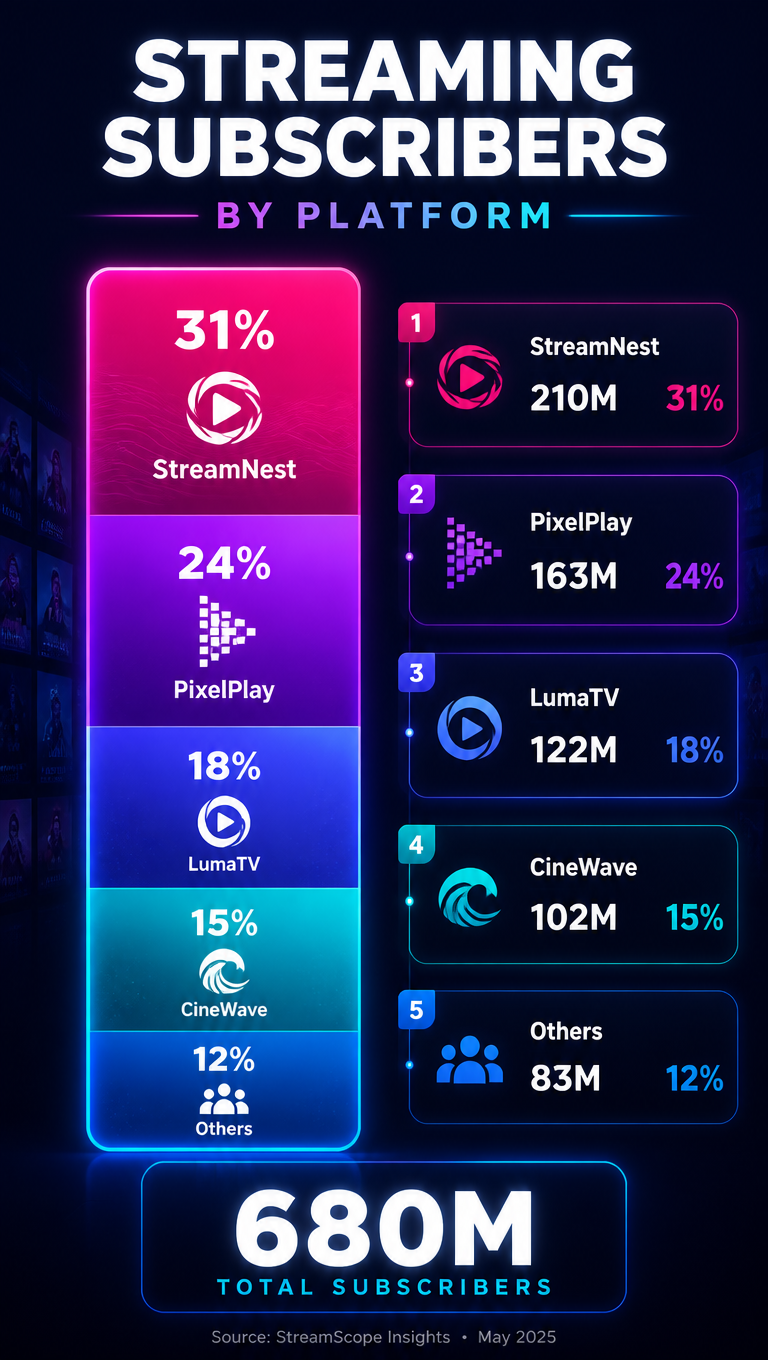
Streaming Platform Share
GPT Image 2en

A media market-share infographic, 9:16, titled 'Streaming Subscribers by Platform'. A vertical stacked-column layout where one tall bar splits into invented services: StreamNest 31%, PixelPlay 24%, LumaTV 18%, CineWave 15%, Others 12%, each segment labeled with a percentage and a

Ride-Hailing Market Share
GPT Image 2en

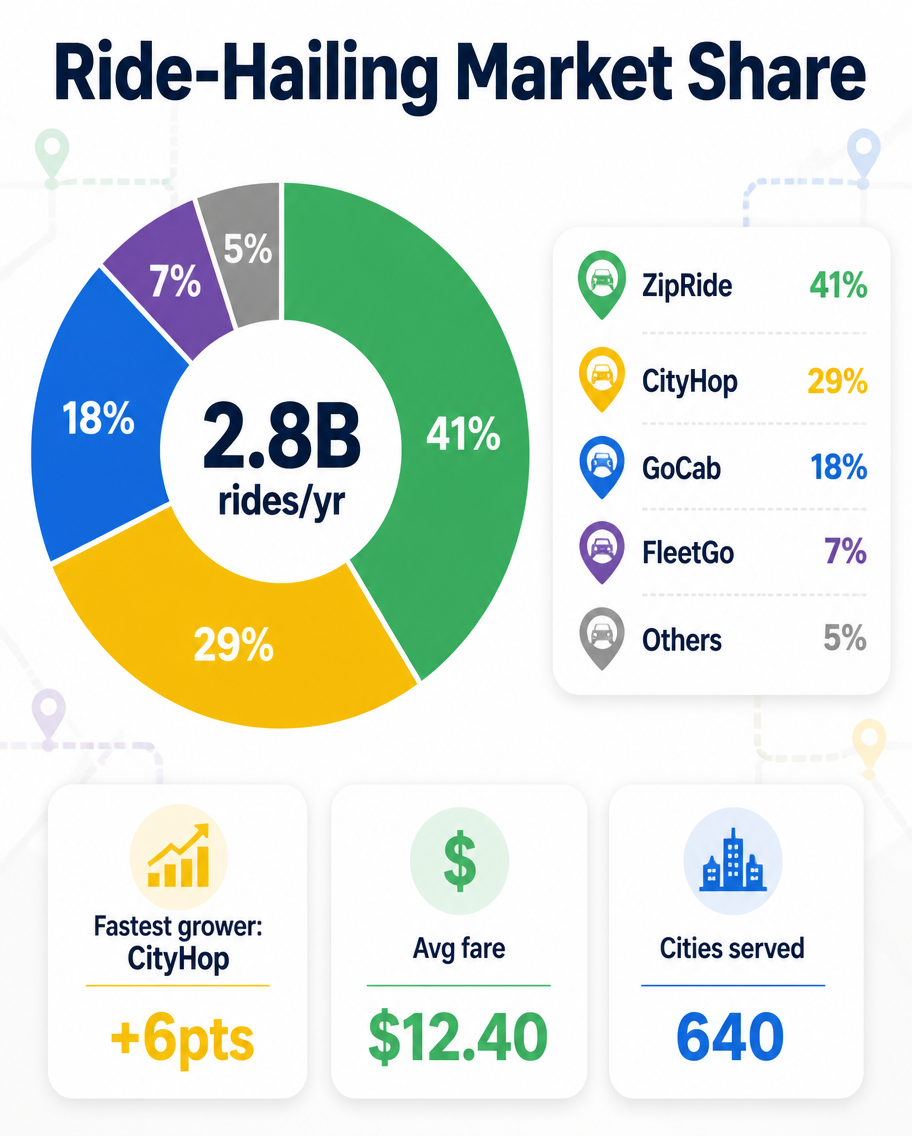
A mobility market-share infographic, 4:5, titled 'Ride-Hailing Market Share'. A donut chart divides invented apps: ZipRide 41% (green), CityHop 29% (yellow), GoCab 18% (blue), FleetGo 7% (purple), Others 5% (grey). Center reads '2.8B rides/yr'. A legend with car-pin color chips a

Social Platform Market Share
GPT Image 2en

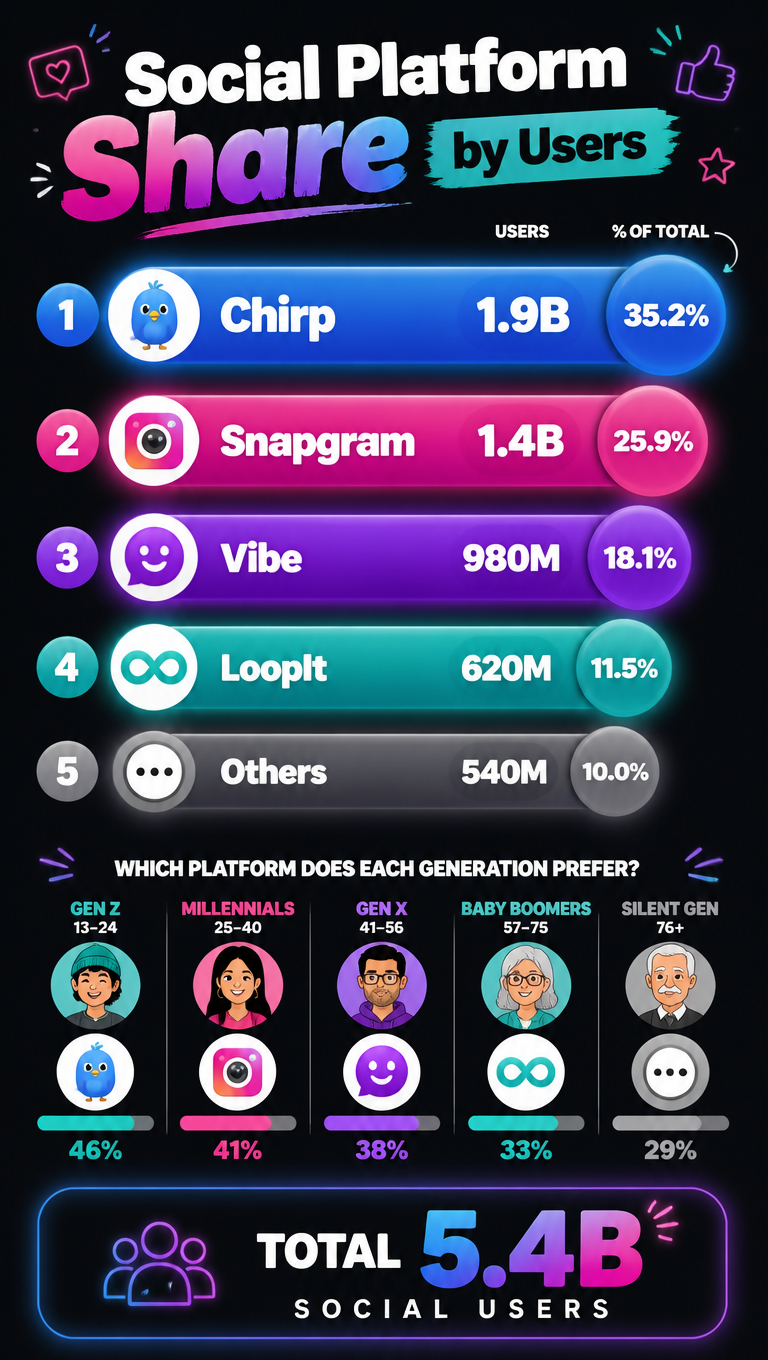
A social-media market-share infographic, 9:16, titled 'Social Platform Share by Users'. A vertical ranked layout: horizontal bubble bars for invented platforms sized by users: Chirp 1.9B (blue), Snapgram 1.4B (magenta), Vibe 980M (purple), LoopIt 620M (teal), Others 540M (grey),