原始文档
GPT Image 2 · en
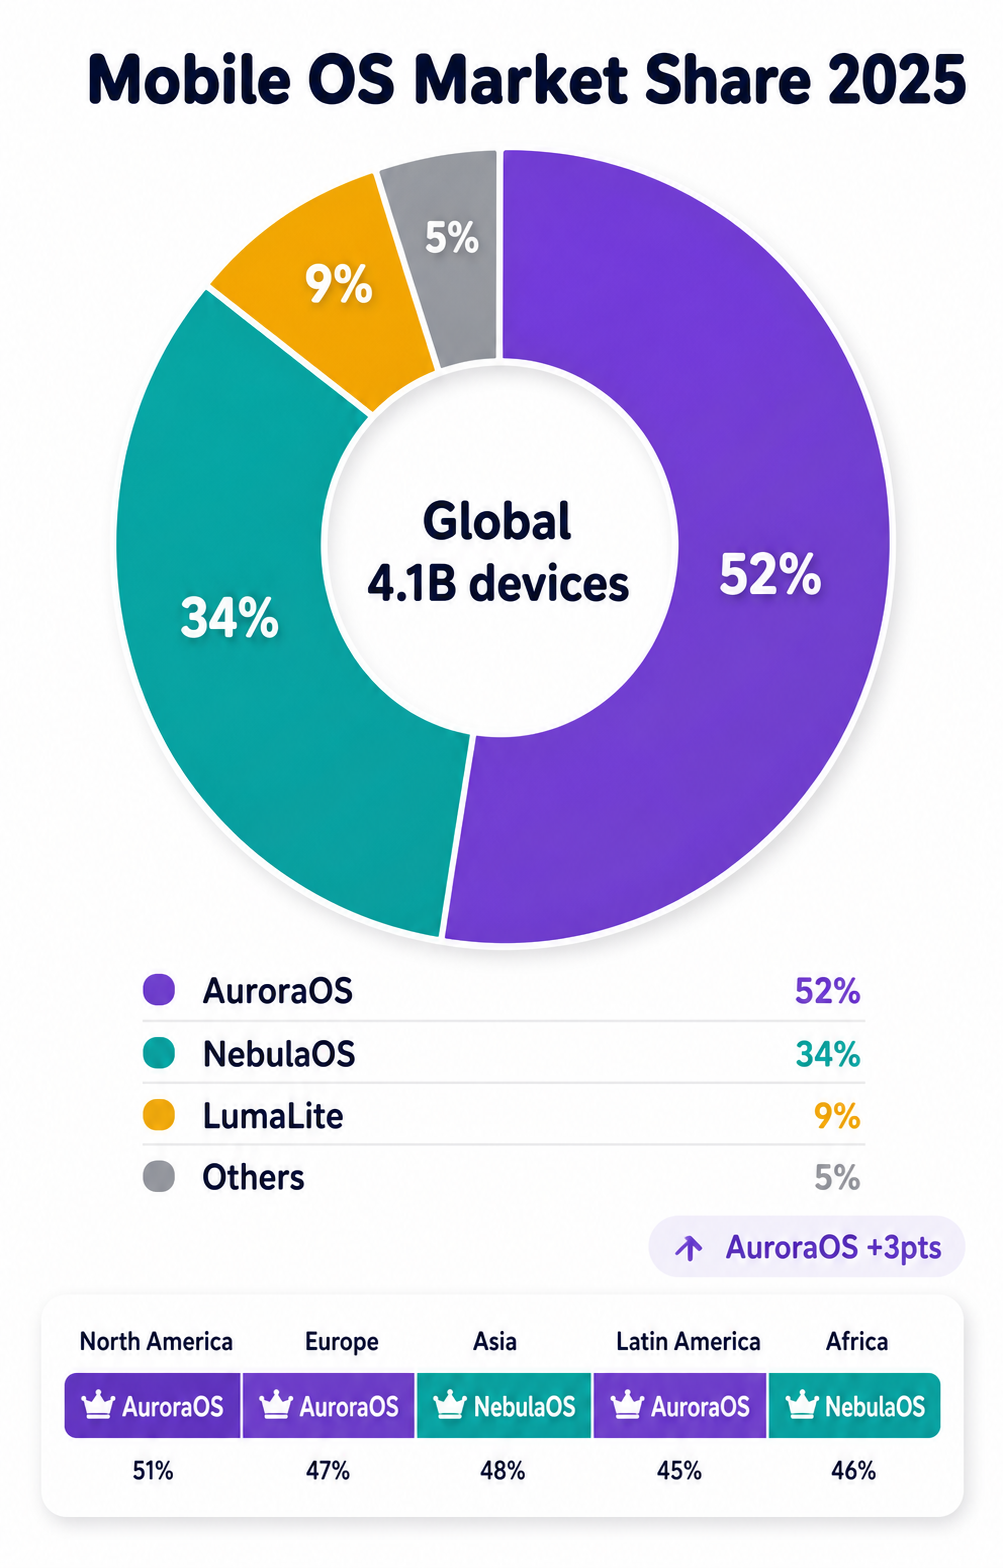
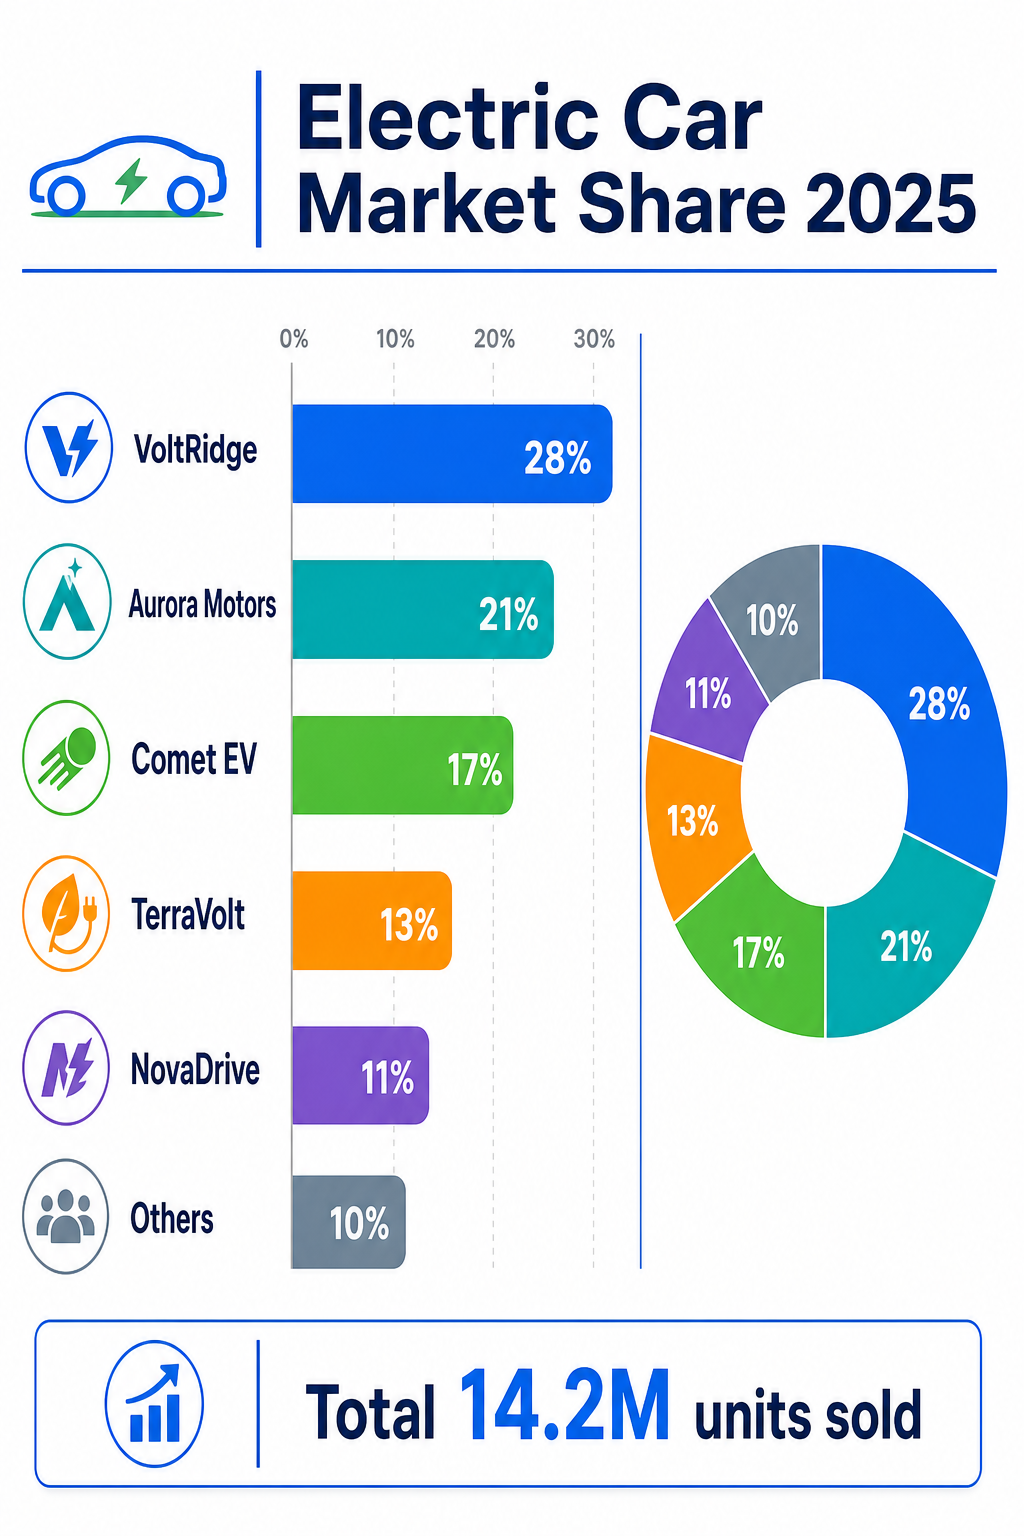
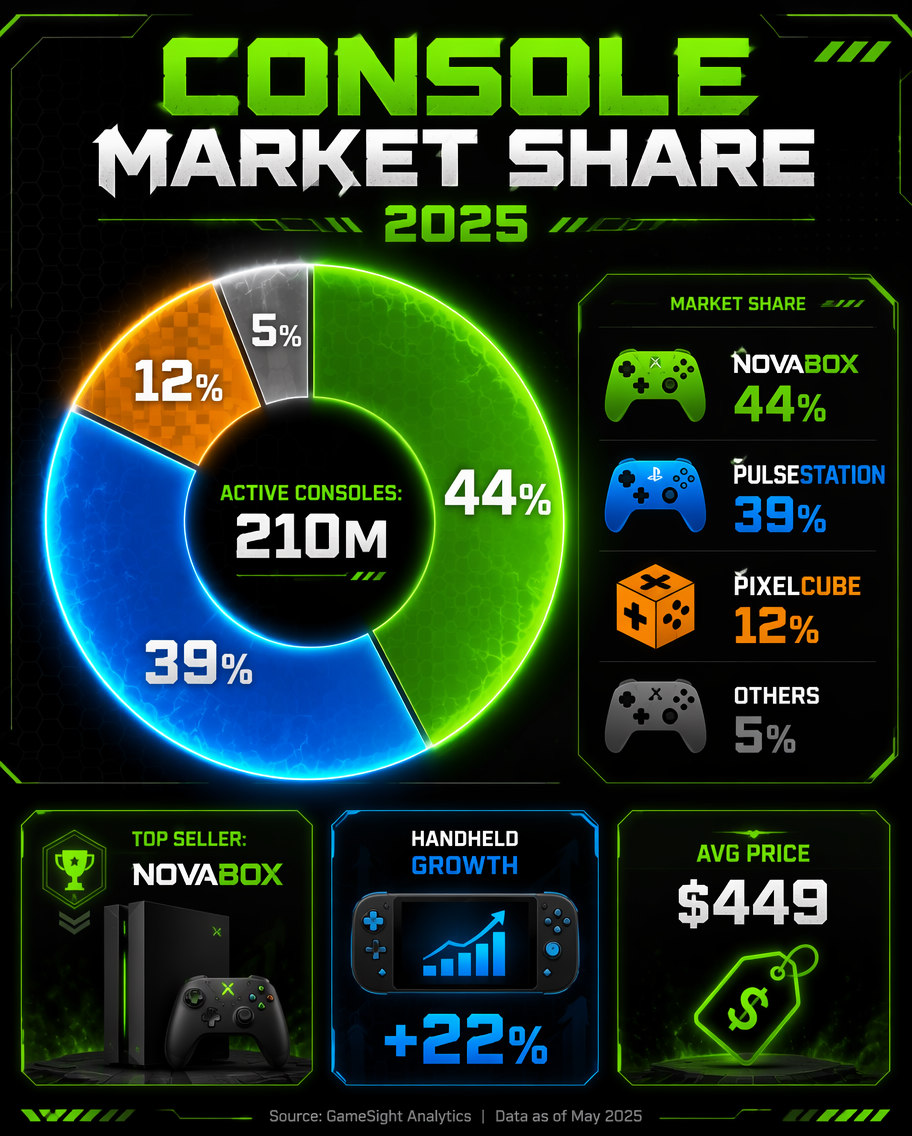
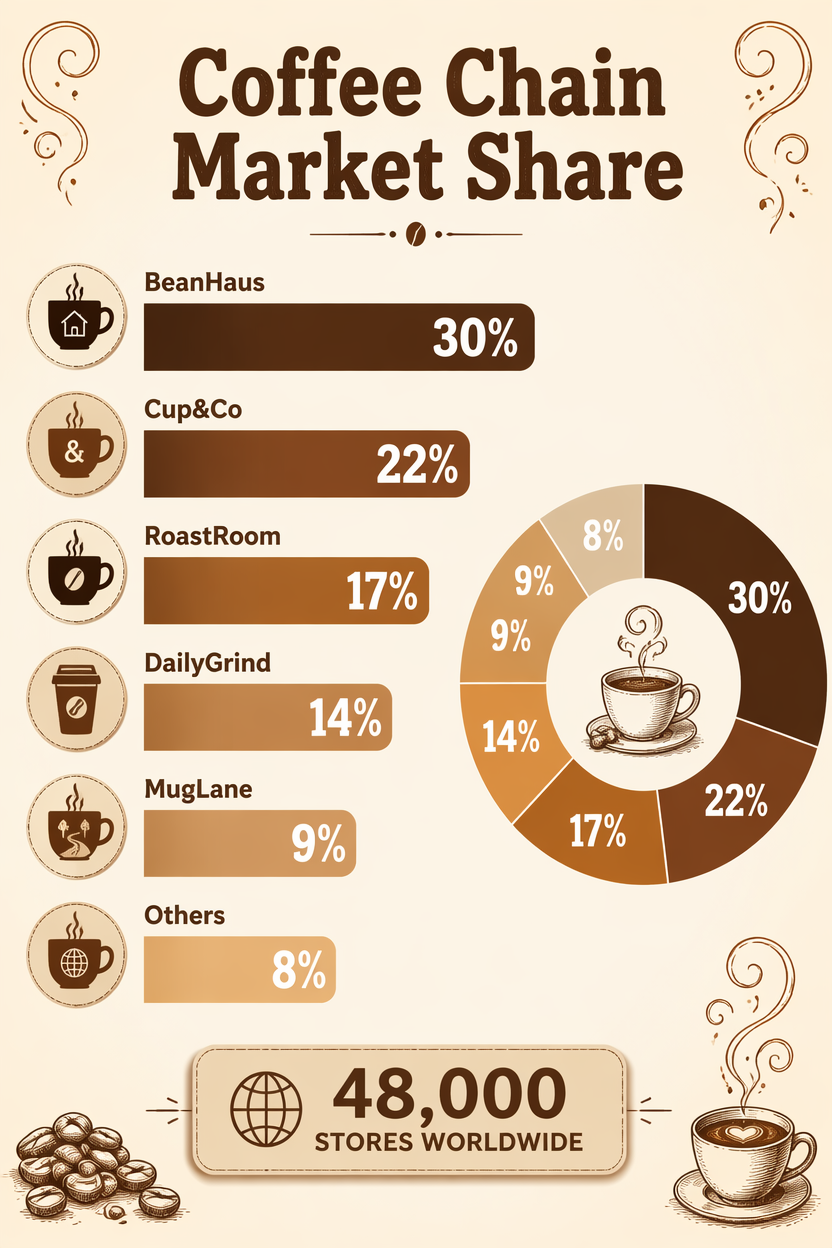
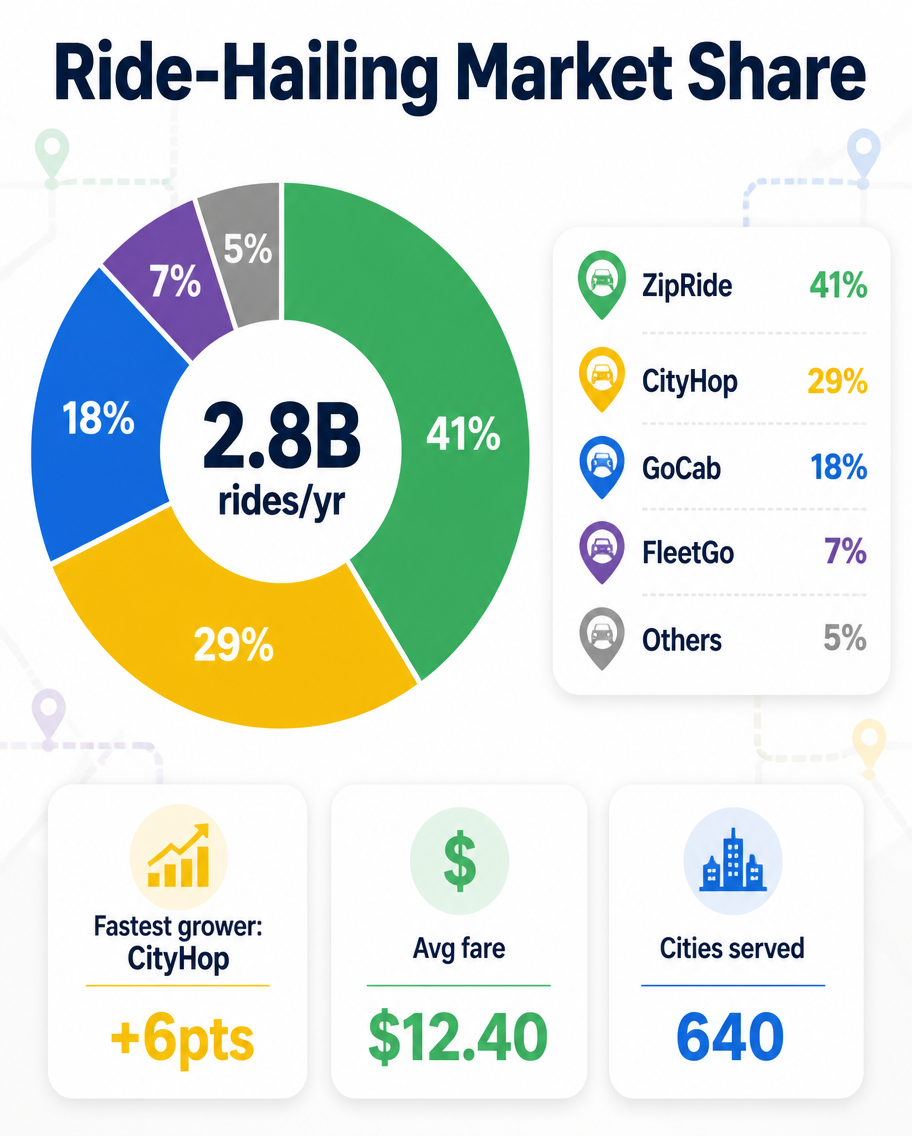
A mobility market-share infographic, 4:5, titled 'Ride-Hailing Market Share'. A donut chart divides invented apps: ZipRide 41% (green), CityHop 29% (yellow), GoCab 18% (blue), FleetGo 7% (purple), Others 5% (grey). Center reads '2.8B rides/yr'. A legend with car-pin color chips and percentages, plus three mini tiles: 'Fastest grower: CityHop +6pts', 'Avg fare $12.40', 'Cities served 640'. Clean white background, flat design, map-route line motifs faintly in the background, rounded widgets, modern mobility data-report aesthetic, bold headline.使用方法
- 复制完整原始提示词,并保留其中的参数。
- 按需求替换主体、文字和构图要求。
- 在兼容的外部工具中使用,核对当前使用条件并检查结果。
开始前需了解
- 先确认是否需要参考图。标注兼容模型,不代表该示例由这个模型生成。
- 核对名称、数字与画面文字;不同模型版本的结果可能不同。