Original document
GPT Image 2 · en
{
  "type": "Plant and Nutrition Infographic Poster",
  "subject": {
    "name": "{argument name=\"subject name\" default=\"Ganoderma lucidum\"}",
    "scientific_name": "{argument name=\"scientific name\" default=\"Ganoderma lucidum\"}",
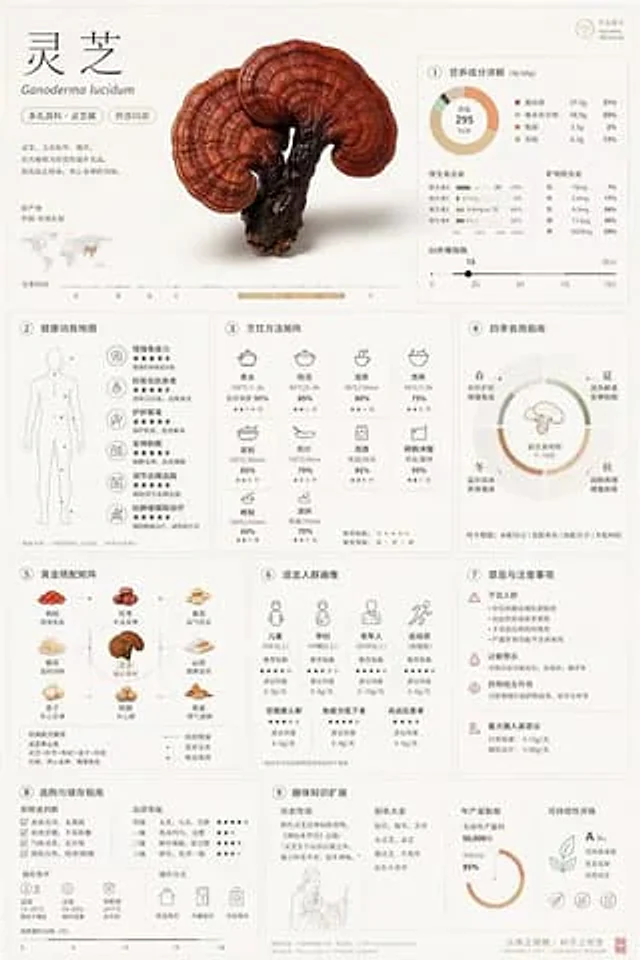
    "image": "A large, richly detailed illustration shows a glossy, reddish-brown Ganoderma lucidum with concentric growth rings, located at the top center."
  },
  "layout": {
    "style": "Simple, modern, and grid-based, with a light beige background accented by subtle grid lines, minimalist icons, and data visualization elements.",
    "sections": [
      {
        "title": "Header/Introduction (Top Left)",
        "content": "The main title text, scientific name, label ('Polyporaceae·Ganoderma', 'Medicinal and edible'), brief description, distribution map (China/East Asia), and seasonal timeline bar chart."
      },
      {
        "title": "1. Detailed Nutritional Information (per 100g) (Top Right)",
        "content": "Nutritional breakdown. Includes a pie chart showing calories (295 kcal), a table of percentages for macronutrients (protein, carbohydrates, fat, etc.), a two-bar chart for vitamins and minerals, and a GI index slider (value 15)."
      },
      {
        "title": "2. Health Benefits Map (Middle Left)",
        "content": "Health Benefits Map. Featuring a unique human silhouette diagram with 6 markers connected to icons and text blocks, describing its benefits (such as immune regulation, anti-aging, liver protection, sleep aid, blood sugar/lipid regulation, and adjunctive treatment for tumors), each item is assigned a 5-star rating."
      },
      {
        "title": "3. Cooking Method Matrix (Medium-Medium)",
        "content": "Cooking Method Matrix. A 3x3 grid of 9 icons representing different processing methods (boiling, stewing, brewing tea, cooking porridge, steaming, stir-frying, soaking in alcohol, grinding into powder, baking, and cold dishes). Each item includes temperature/time, percentage of nutrient retention, and a star rating."
      },
      {
        "title": "4. Seasonal Food Guide (middle right)",
        "content": "Seasonal Consumption Guide. A circular diagram around the central Ganoderma lucidum icon, divided into four quadrants (spring, summer, autumn, and winter), details the seasonal benefits and optimal consumption period (7-10 months)."
      },
      {
        "title": "5. Golden Pairing Matrix (bottom left)",
        "content": "The Golden Pairing Matrix. A 3x3 grid showcasing eight complementary ingredients surrounding the central Ganoderma lucidum (goji berries, red dates, astragalus, white fungus, yam, lotus seeds, longan, and dried tangerine peel), accompanied by text explaining the synergistic effects."
      },
      {
        "title": "6. Target Audience Profile (Part 2)",
        "content": "Suitable user profiles. Icons and text are used to display recommended daily intake and star ratings for 7 user groups (children, pregnant women, the elderly, athletes, people in a sub-healthy state, people with low immunity, and people with high blood pressure)."
      },
      {
        "title": "7. Taboos and Precautions (bottom right)",
        "content": "Contraindications and precautions. List format with warning icons, covering unsuitable populations, allergy warnings, drug interactions, and recommended maximum daily intake."
      },
      {
        "title": "8. Selection and Storage Guide (Bottom Left, bottom of Part 5)",
        "content": "Selection and storage guide. Includes a freshness checklist, quality grading chart (premium, grade 1, grade 2, grade 3) and star rating, storage condition icons (temperature, humidity, shelf life), and shelf life timeline."
      },
      {
        "title": "9. Fun Facts Expanded (Bottom Right, Below Part 7)",
        "content": "Fun trivia expansion. Text blocks cover historical legends, alternative names, global production data (50,000 tons, with China accounting for 85%), and sustainability rating (Grade A)."
      }
    ]
  }
}
How to use
- Copy the complete original prompt, including any parameters.
- Replace the subject, text and composition with your own requirements.
- Use a compatible external tool; check its current access conditions and review the result.
Before you start
- Check whether a reference image is required. A compatible model label does not mean this example was generated with that model.
- Keep names, figures and visible text accurate; results can vary between model versions.