The Water Cycle

The Water Cycle

Original document

GPT Image 2 · en

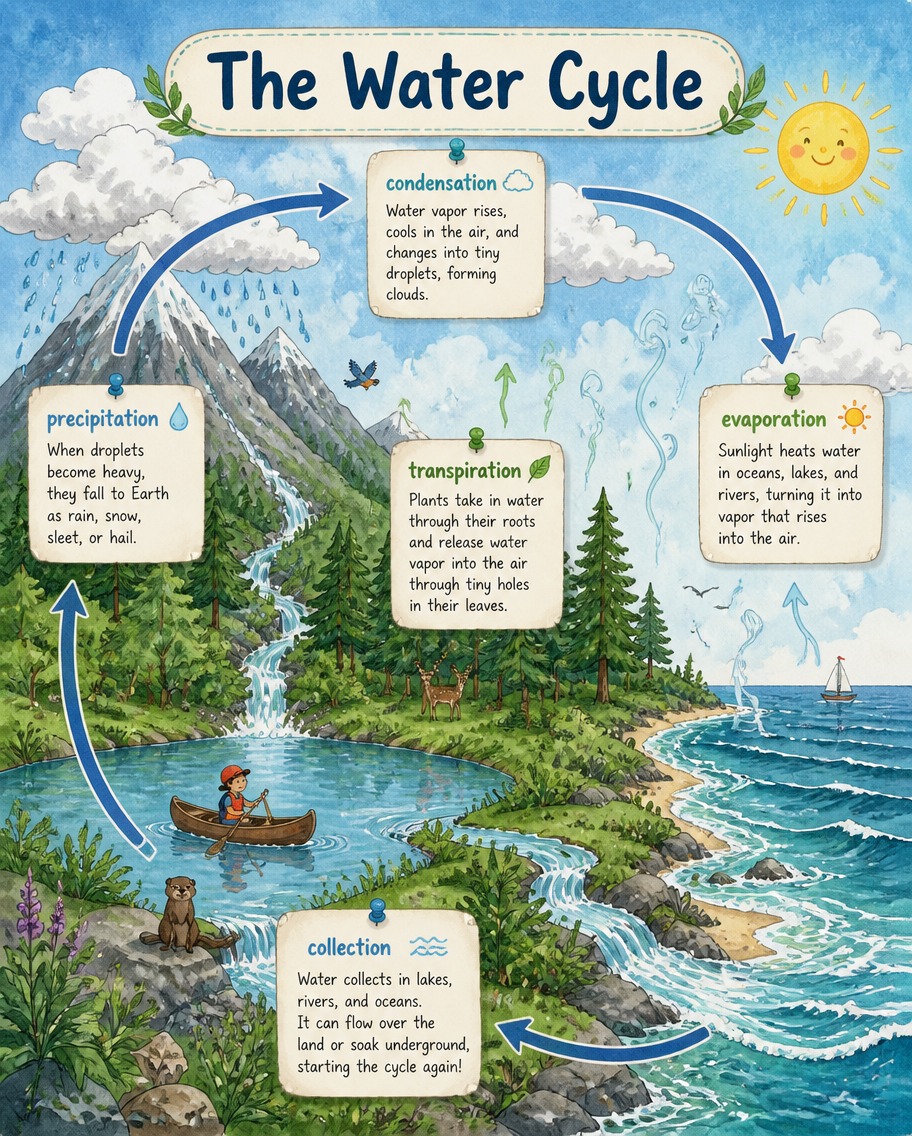
An earth-science infographic of the water cycle drawn as one continuous landscape scene. A mountain, forest, lake and ocean sit under a cloud-filled sky, connected by looping arrows labeled 'evaporation', 'condensation', 'precipitation', 'collection' and 'transpiration'. Tiny sun, raindrops and vapor swirls act as icons. Hand-illustrated storybook style with textured watercolor washes in teal, sky blue and moss green. Rounded title banner 'The Water Cycle' across the top, short caption paragraphs pinned beside each stage. Playful, kid-friendly composition.

How to use

  1. Copy the complete original prompt, including any parameters.
  2. Replace the subject, text and composition with your own requirements.
  3. Use a compatible external tool; check its current access conditions and review the result.

Before you start

  • Check whether a reference image is required. A compatible model label does not mean this example was generated with that model.
  • Keep names, figures and visible text accurate; results can vary between model versions.
More like this

The Software Development Lifecycle
GPT Image 2en

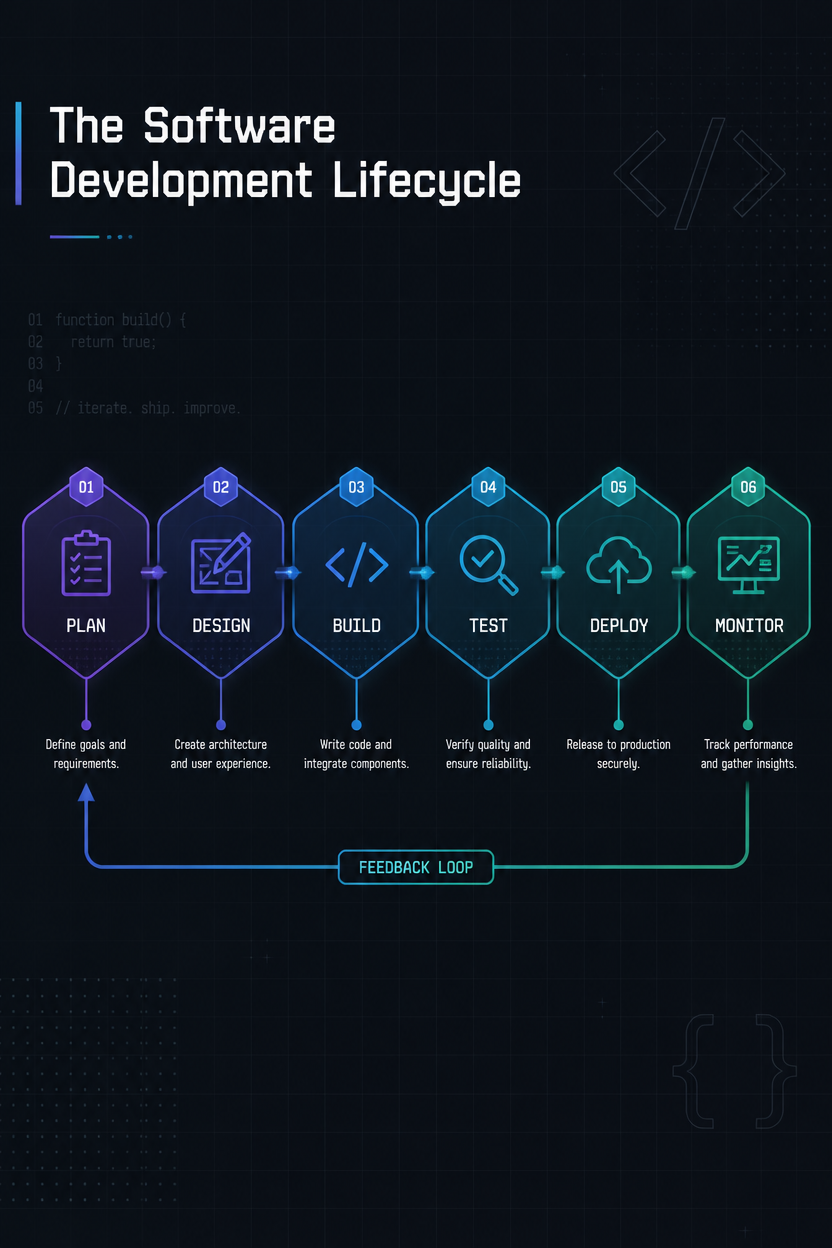
A tech process infographic of the software development lifecycle shown as a horizontal pipeline. Stages - plan, design, build, test, deploy, monitor - appear as connected hexagonal nodes with matching icons and a one-line goal each, plus a feedback arrow looping from monitor back

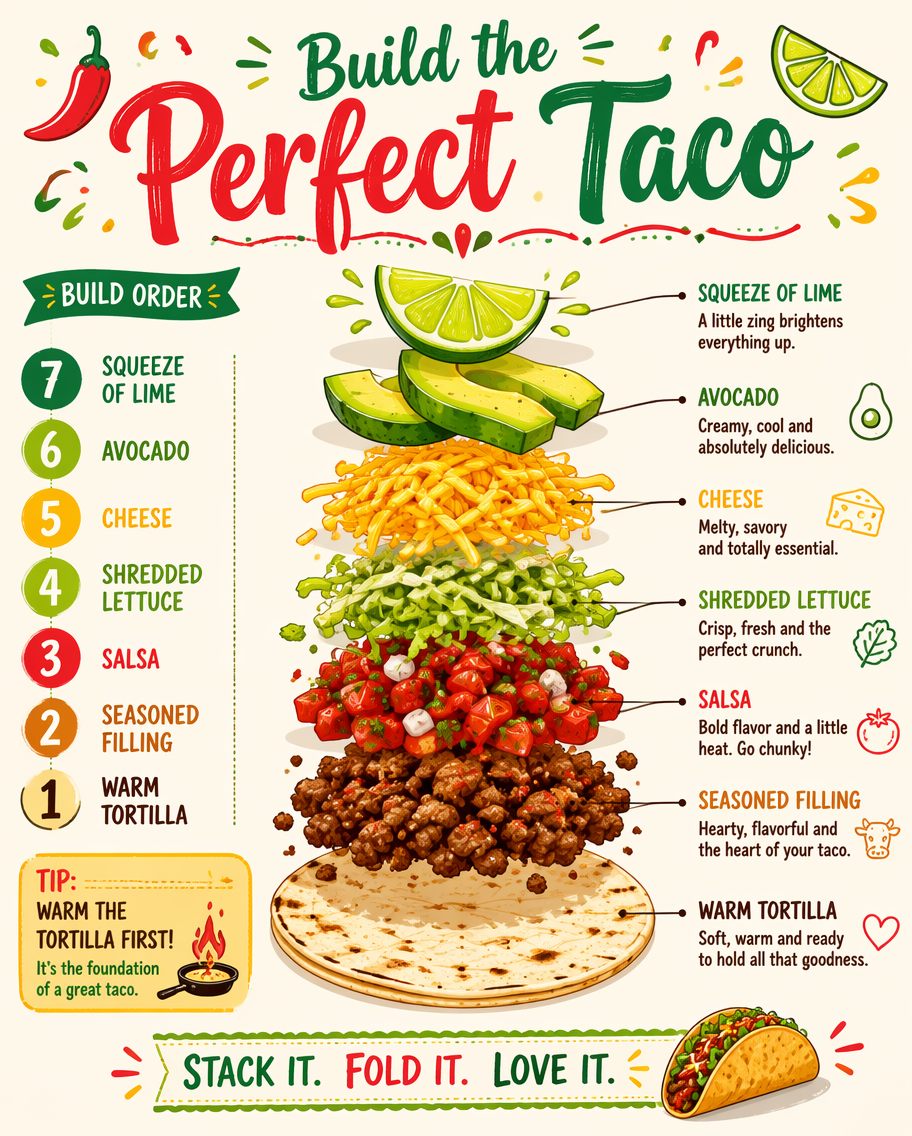
Build the Perfect Taco
GPT Image 2en

A cooking infographic showing how to build the perfect taco, drawn as an exploded stack of labeled layers plus a numbered assembly order. From a warm tortilla up through seasoned filling, salsa, shredded lettuce, cheese, avocado and a squeeze of lime, each layer has a leader line

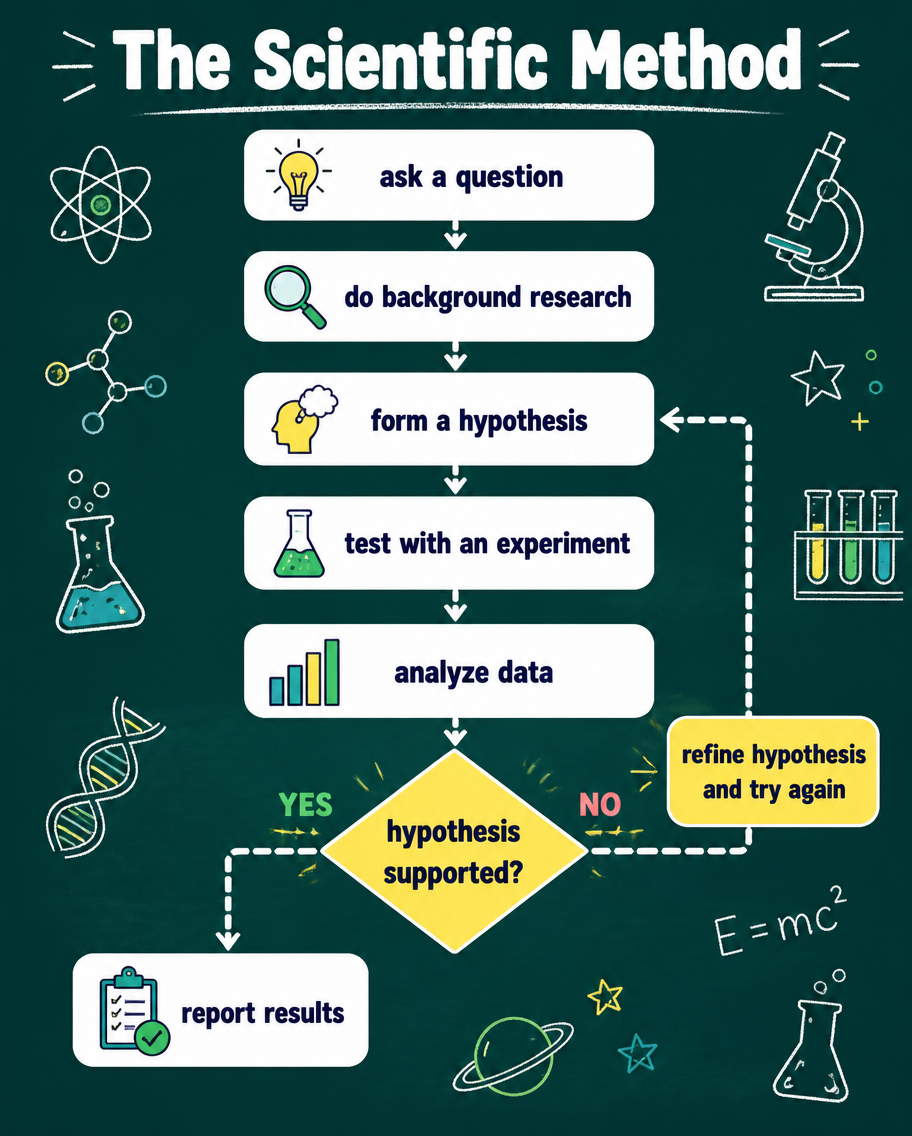
The Scientific Method
GPT Image 2en

An education flowchart infographic of the scientific method drawn as a top-to-bottom decision diagram. Rounded boxes read 'ask a question', 'do background research', 'form a hypothesis', 'test with an experiment', 'analyze data', then a decision diamond 'hypothesis supported?' br

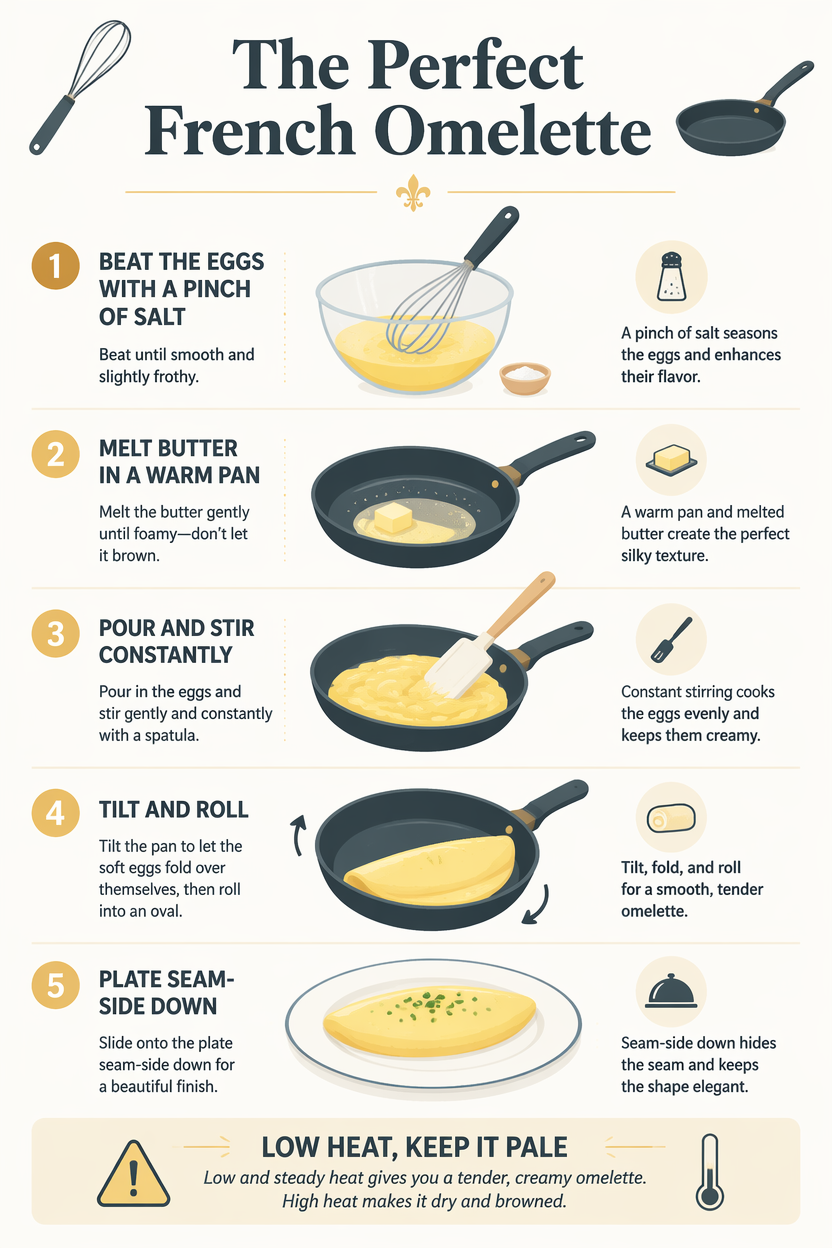
The Perfect French Omelette
GPT Image 2en

A cooking infographic teaching the classic French omelette as a numbered 5-step sequence. Steps - beat the eggs with a pinch of salt, melt butter in a warm pan, pour and stir constantly, tilt and roll, plate seam-side down - each carry a clean side-view illustration and a short t

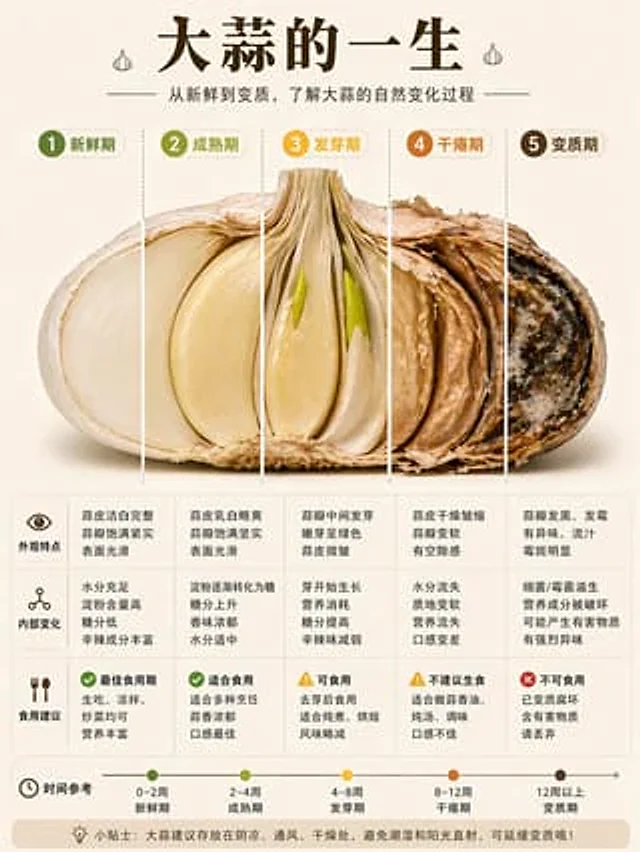
Garlic Life Cycle Infographic
GPT Image 2en

{ "type": "Chinese infographic poster", "topic": "The life cycle of garlic from fresh to spoilage", "style": "Concise, editable food infographics with high information density; high-quality social media science posters; warm, neutral color palette; realistic food cross-sect

Bill The Investor #278
GPT Image 2zh

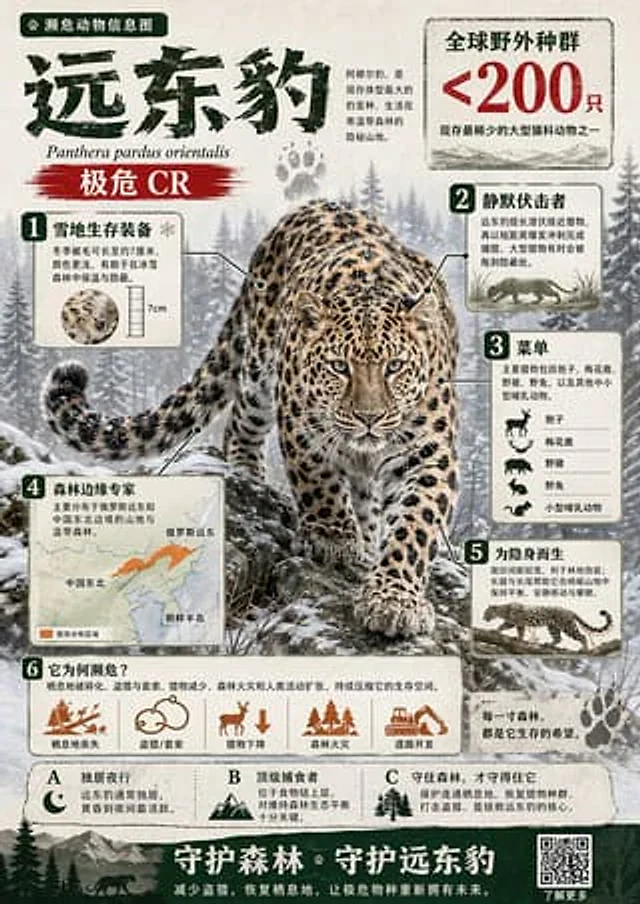
Create a visually rich infographic in Chinese about an endangered animal. Start by finding one online, research its habitat, diet, and unique traits. Present information through annotated visuals and structured callouts, not generic sections. Style it like a bold graphic illustra