Original document
GPT Image 2 · en
{
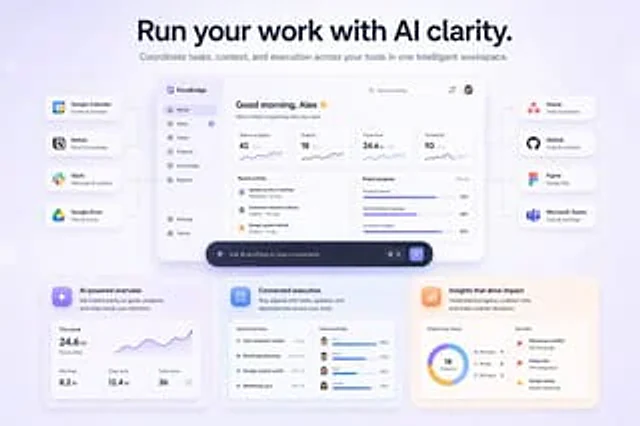
"type": "SaaS landing page homepage graphics",
"style": "Modern UI/UX, light theme, soft shadows, frosted glass effect{argument name=\"primary theme color\" default=\"Purple and blue gradient\"}",
"header": {
"headline": "{argument name=\"main headline\" default=\"Drive your work with a clear AI perspective.\"}",
"subheadline": "Coordinate tasks, contexts, and execution across tools in a smart workspace."
},
"layout": {
"center_dashboard": {
"app_name": "{argument name=\"app name\" default=\"FlowBridge\"}",
"greeting": "{argument name=\"user greeting\" default=\"Good morning, Alex 👋\"}",
"sidebar_links": 8,
"top_metrics_cards": 4,
"recent_activity_items": 3,
"project_progress_bars": 3,
"floating_action_bar": "{argument name=\"floating bar text\" default=\"Ask the AI a question or enter a command...\"}"
},
"left_integrations": {
"count": 4,
"style": "Capsule-shaped card connected to the central dashboard via a thin wire",
"labels": [
"Google Calendar: Events and Schedules",
"Notion: Documentation and Knowledge Base",
"Slack: Messages and Updates",
"Google Drive: Files and Assets"
]
},
"right_integrations": {
"count": 4,
"style": "Capsule-shaped card connected to the central dashboard via a thin wire",
"labels": [
"Asana: Tasks and Projects",
"GitHub: Code and Commits",
"Figma: Design Files",
"Microsoft Teams: Calls and Meetings"
]
},
"bottom_feature_cards": {
"count": 3,
"style": "Rectangular cards with soft shadows",
"cards": [
{
"title": "AI-driven overview",
"description": "Stay informed about goals, progress, and matters requiring your attention.",
"visuals": "Displays a line graph of 24.6 hours of focus time, along with three bottom indicators (meetings, deep work, and completed tasks)."
},
{
"title": "Interconnected execution",
"description": "Keep tasks, updates, and dependencies synchronized across tools.",
"visuals": "Includes a list of 4 upcoming tasks and 4 team workload progress bars with user avatars."
},
{
"title": "Insights into Driving Influence",
"description": "Understand the progress, mitigate risks, and make more informed decisions.",
"visuals": "A pie chart showing the status of 18 projects, and a list of 3 major risks marked with red flags."
}
]
}
}
}How to use
- Copy the complete original prompt, including any parameters.
- Replace the subject, text and composition with your own requirements.
- Use a compatible external tool; check its current access conditions and review the result.
Before you start
- Check whether a reference image is required. A compatible model label does not mean this example was generated with that model.
- Keep names, figures and visible text accurate; results can vary between model versions.