Pour-Over Coffee Guide

Pour-Over Coffee Guide

Original document

Seedream 4.5 · en

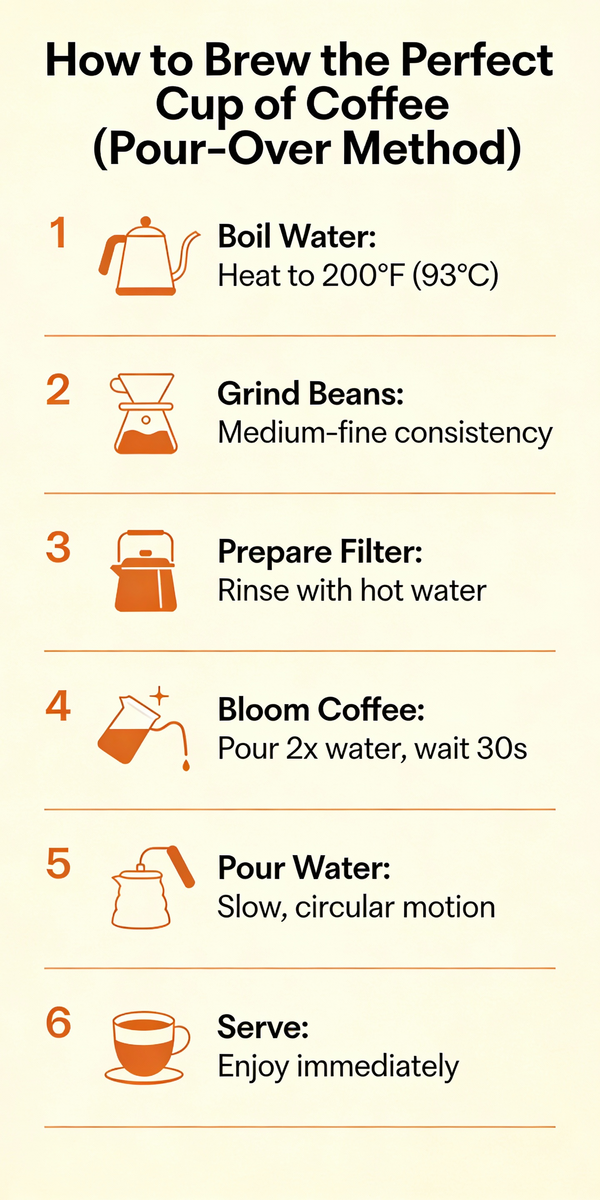
A simple, step-by-step visual guide on “How to Brew the Perfect Cup of Coffee using a Pour-Over Method.” The infographic should have 6–8 steps, each with a clean icon and a short, clear instruction (e.g., “1. Boil Water,” “2. Grind Beans”). The style should be minimalist and icon-based, with a warm color palette. This is for a lifestyle blog or cafe, requiring clear, sequential visual instruction. –ar 1:2

How to use

  1. Copy the complete original prompt, including any parameters.
  2. Replace the subject, text and composition with your own requirements.
  3. Use a compatible external tool; check its current access conditions and review the result.

Before you start

  • Check whether a reference image is required. A compatible model label does not mean this example was generated with that model.
  • Keep names, figures and visible text accurate; results can vary between model versions.
More like this

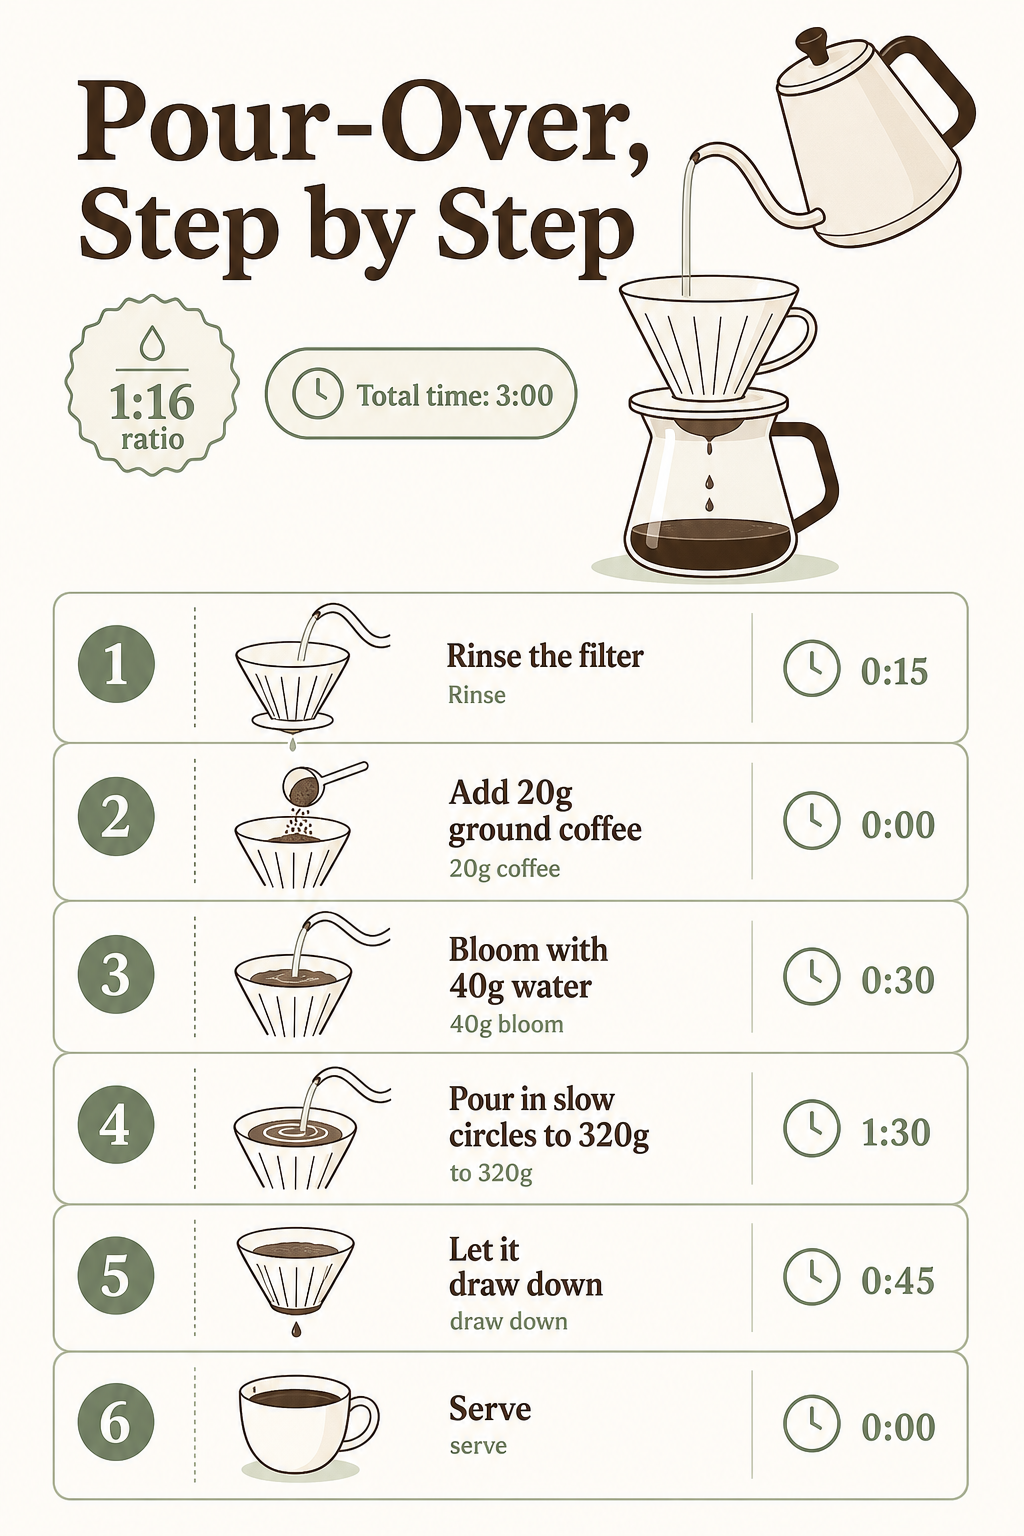
Pour-Over, Step by Step
GPT Image 2en

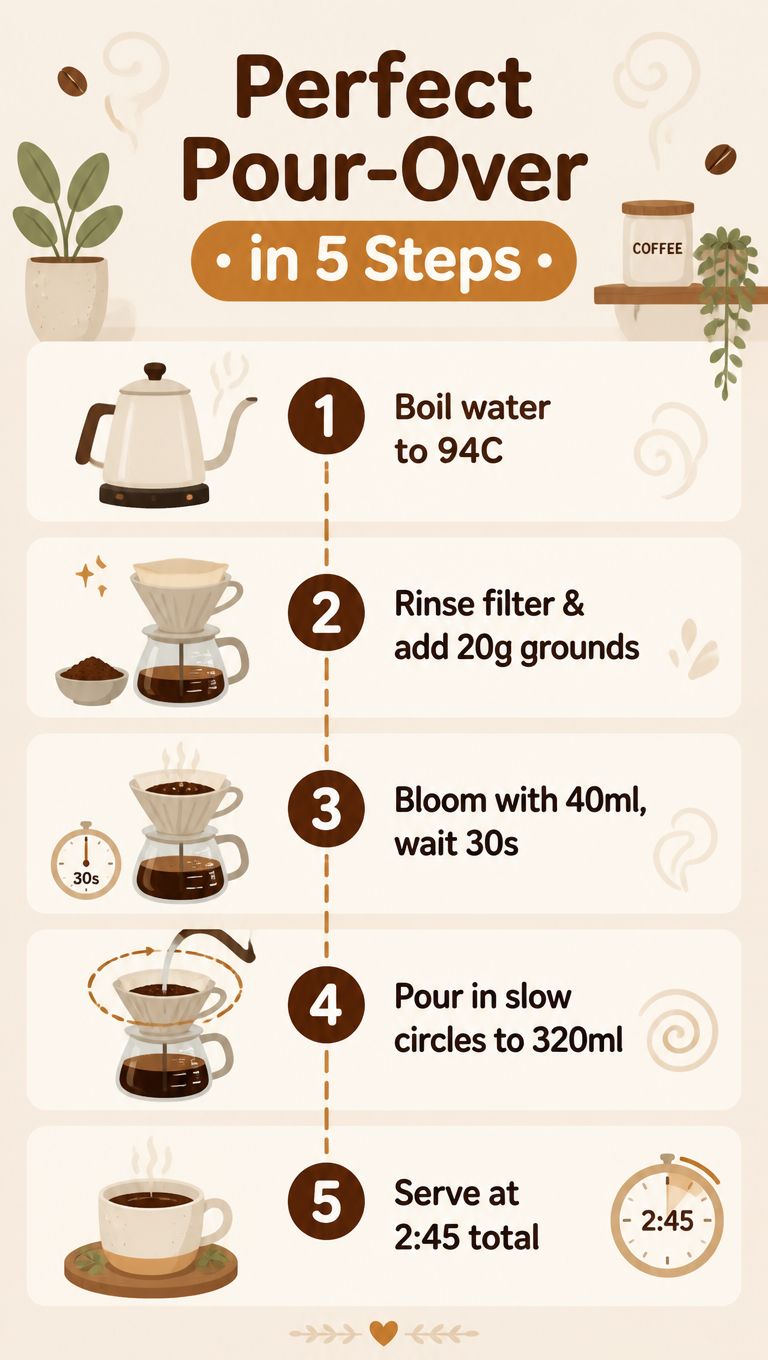
A cooking infographic showing how to brew pour-over coffee as a clean numbered sequence. Steps - rinse the filter, add 20g ground coffee, bloom with 40g water, pour in slow circles to 320g, let it draw down, serve - each carry a minimalist line icon, a ratio note and a small time

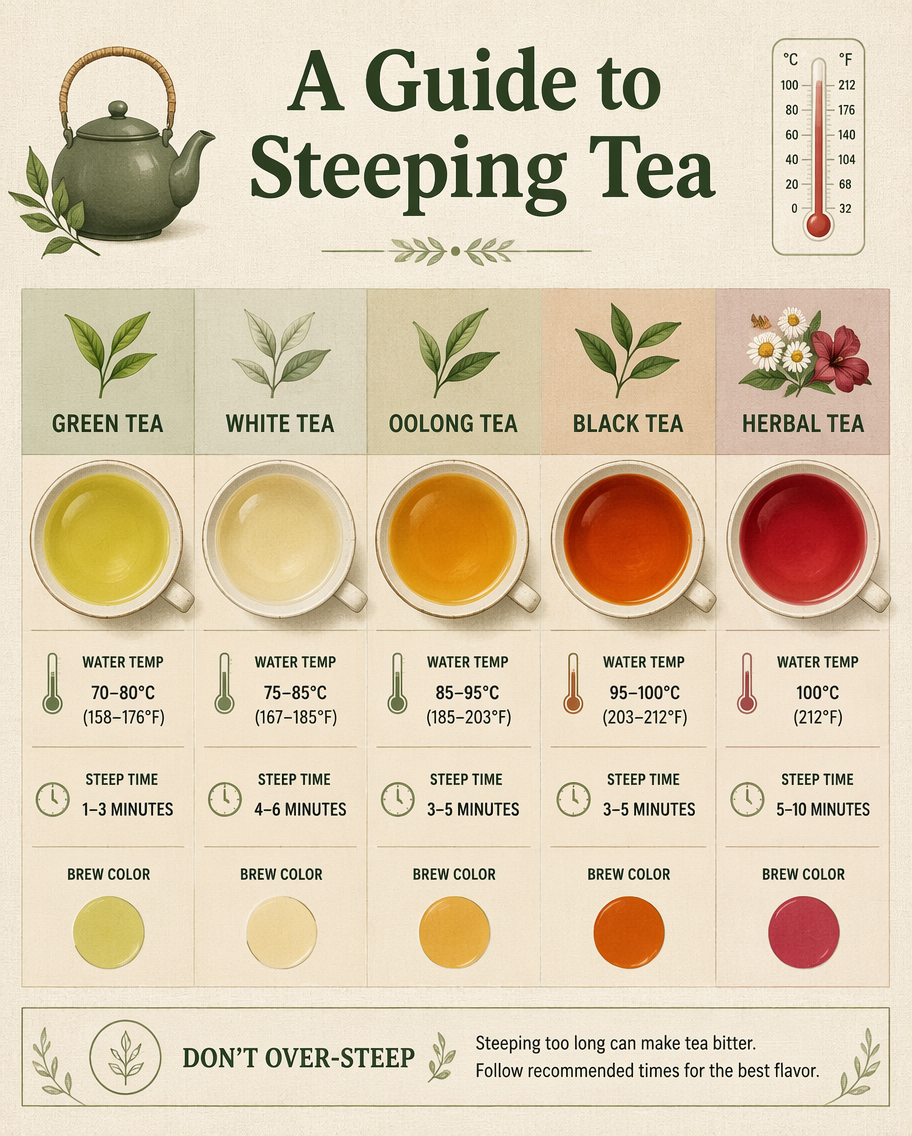
A Guide to Steeping Tea
GPT Image 2en

A cooking infographic guide to steeping tea by type, laid out as a comparison chart of five cups in a row. Columns for green, white, oolong, black and herbal tea each list water temperature, steep time and a color swatch of the brew, topped by a small leaf icon. A calm natural pa

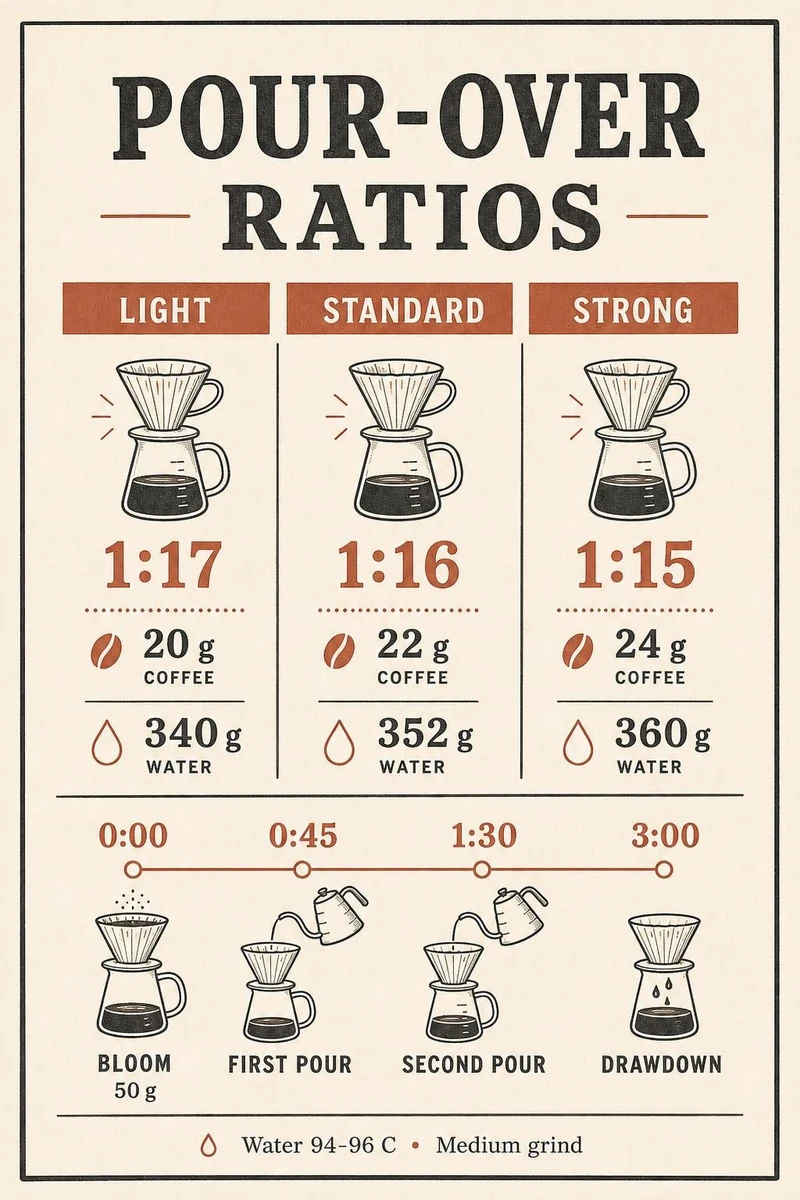
Coffee Brewing Ratio Wall Chart
GPT Image 2en

A printed kitchen wall chart titled "POUR-OVER RATIOS" in bold slab serif, on warm off-white paper with a thin charcoal border. Three labelled columns compare brew strengths: LIGHT (1:17, 20 g coffee, 340 g water), STANDARD (1:16, 22 g coffee, 352 g water), STRONG (1:15, 24 g cof

ChatGPT Image Generation Guide Infographic
GPT Image 2en

{"type":"infographic","style":"Simple, corporate style, flat design, soft color accents, dark blue main color","header":{"logo":"swirl icon","academy_name":"}}{argument name="academy name" default="OpenAI Academy"} ","main_title":"{argument name="main title" default="ChatGPT Imag

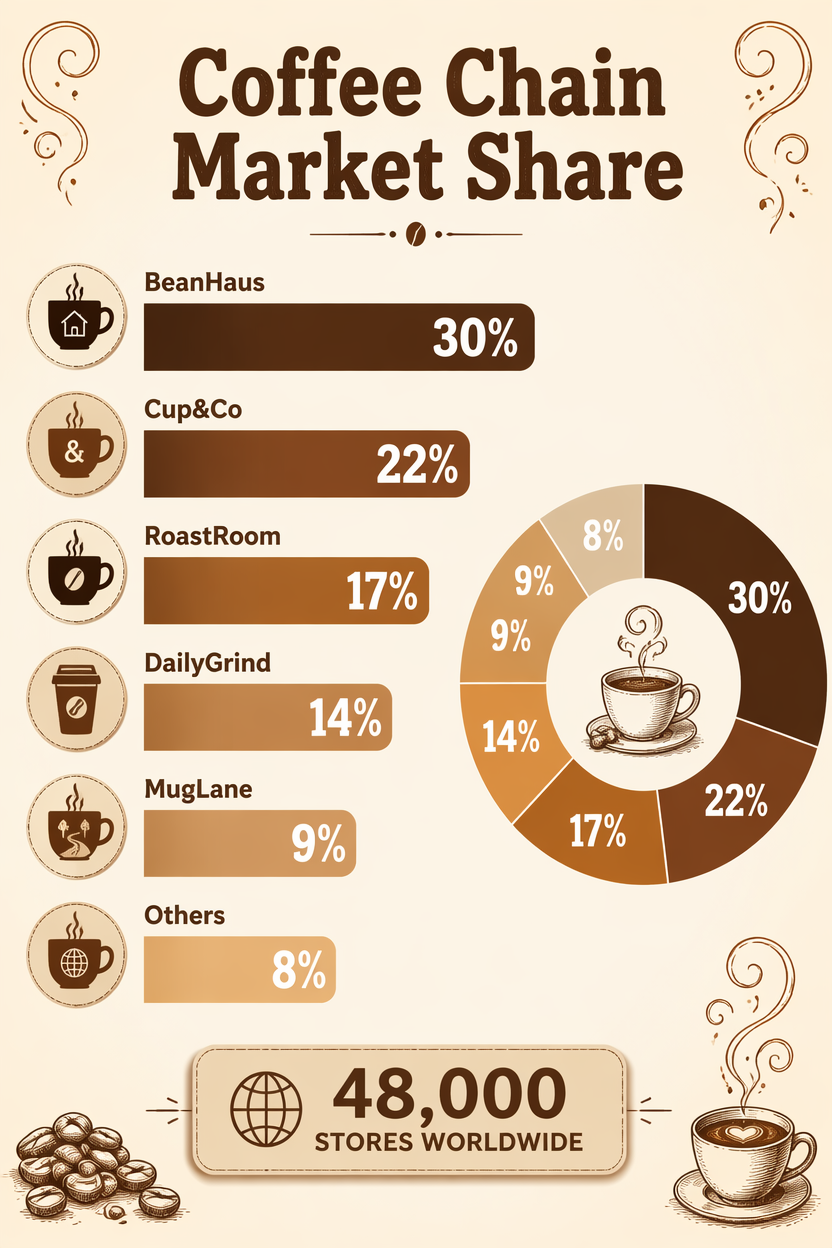
Coffee Chain Market Share
GPT Image 2en

A retail market-share infographic, 2:3, titled 'Coffee Chain Market Share'. A horizontal bar ranking of invented chains: BeanHaus 30%, Cup&Co 22%, RoastRoom 17%, DailyGrind 14%, MugLane 9%, Others 8%, each bar in a warm brown-to-caramel gradient with bold percentages. Small coffe