Web3 Ecosystem Food Chain

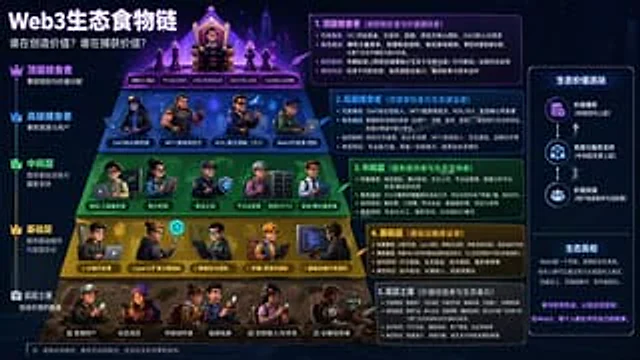
Web3 Ecosystem Food Chain

Original document

GPT Image 2 · en

Please help me generate it.{argument name="market" default="web3"} Different levels of roles in the market, to differentiate{argument name="market" default="web3"} The ecological food chain. The image should include detailed descriptions of the roles and have an aspect ratio of [missing information].{argument name="aspect ratio" default="16:9"} .

How to use

  1. Copy the complete original prompt, including any parameters.
  2. Replace the subject, text and composition with your own requirements.
  3. Use a compatible external tool; check its current access conditions and review the result.

Before you start

  • Check whether a reference image is required. A compatible model label does not mean this example was generated with that model.
  • Keep names, figures and visible text accurate; results can vary between model versions.
More like this

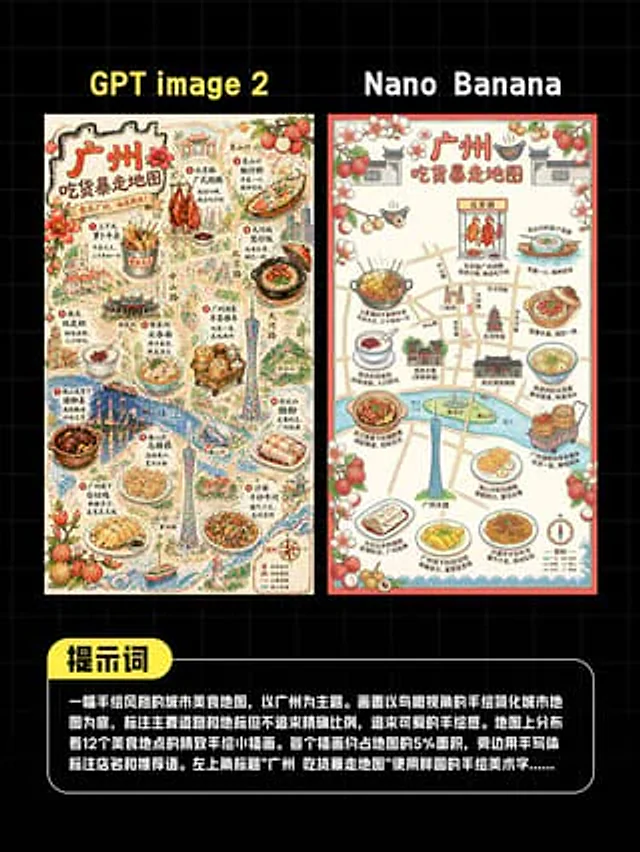
AI Guangzhou Food Map Comparison
GPT Image 2en

This is a comparison image with a black background and a light gray grid, designed in a style similar to a social media quiz result poster. At the top are two large, bold sans-serif headlines side-by-side: "GPT image 2" above the left image and "Nano Banana" above the right. Belo

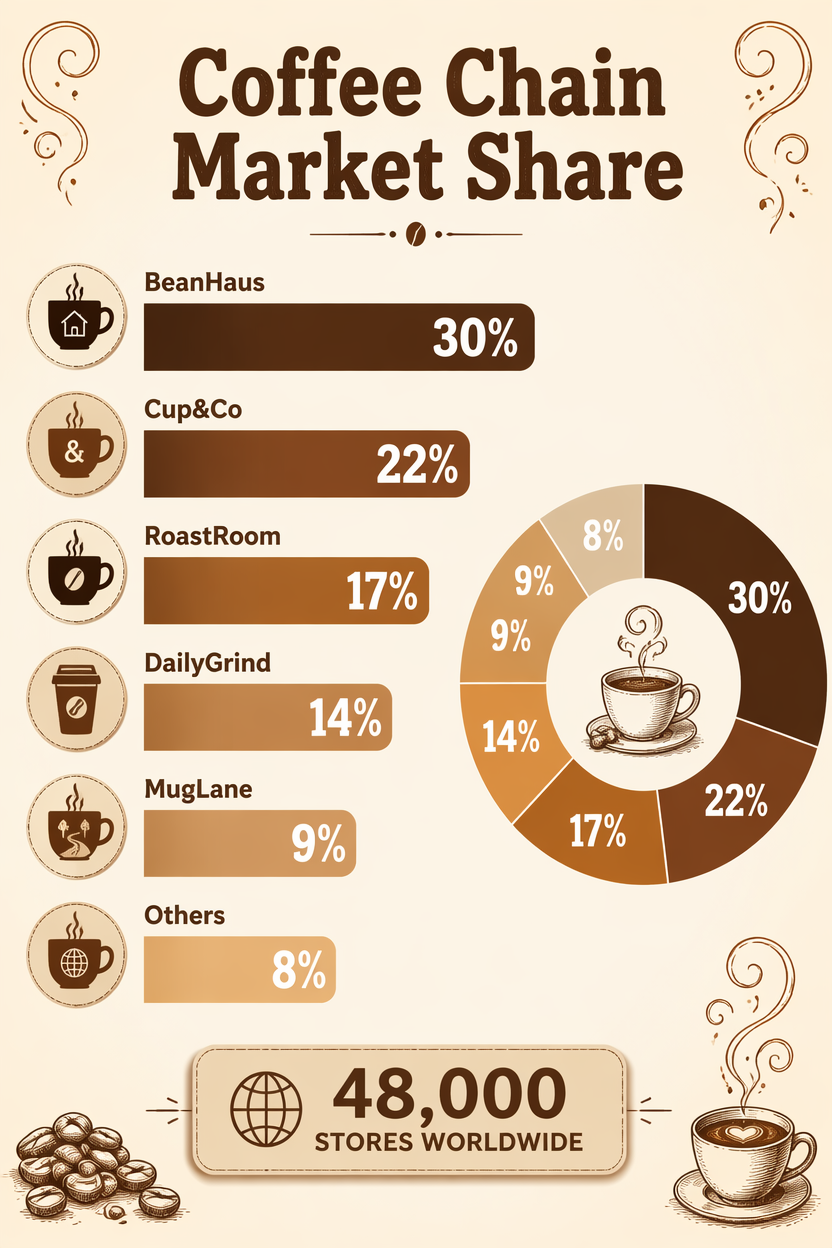
Coffee Chain Market Share
GPT Image 2en

A retail market-share infographic, 2:3, titled 'Coffee Chain Market Share'. A horizontal bar ranking of invented chains: BeanHaus 30%, Cup&Co 22%, RoastRoom 17%, DailyGrind 14%, MugLane 9%, Others 8%, each bar in a warm brown-to-caramel gradient with bold percentages. Small coffe

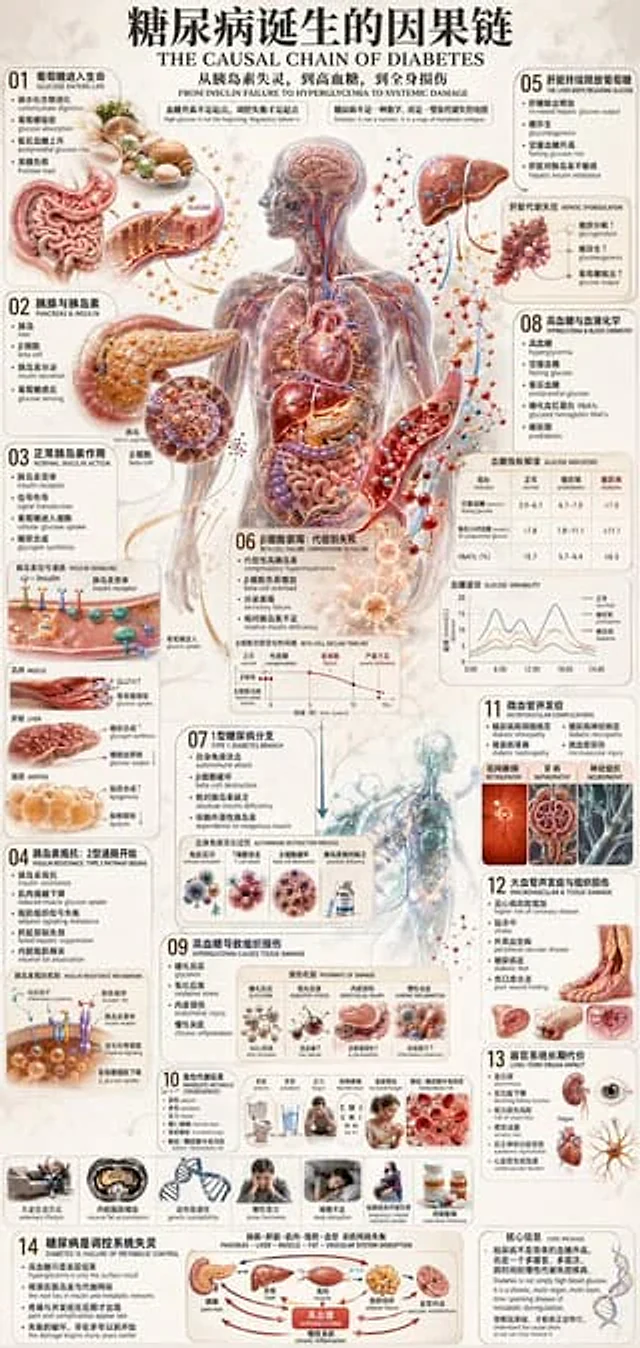
Diabetes Causal Chain Infographic
GPT Image 2en

{ "type": "Medical Infographic Poster", "topic": "Cause and effect chain of diabetes", "language": "Chinese with English subtitle", "style": "High-detail biomedical illustrations, editorial infographics, warm beige parchment background, realistic anatomical structures com