Documento originale
GPT Image 2 · en
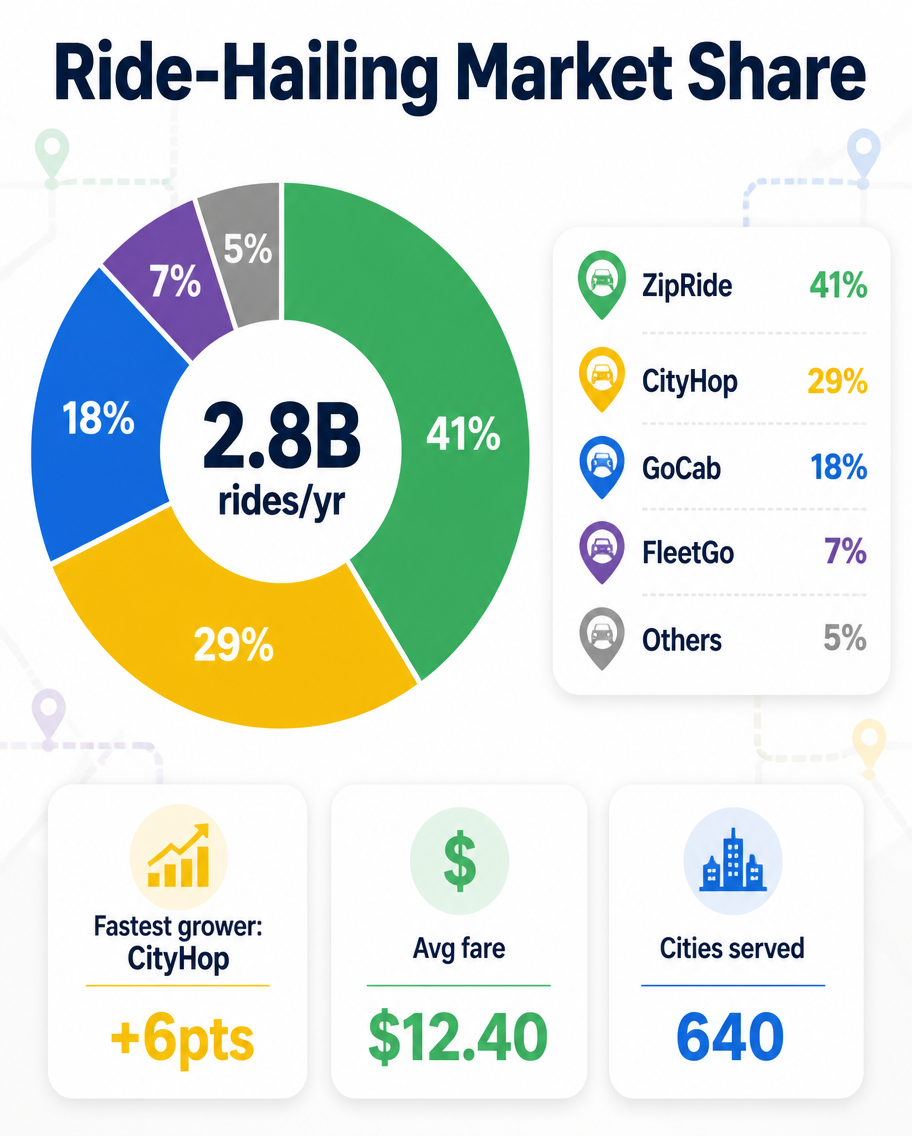
A mobility market-share infographic, 4:5, titled 'Ride-Hailing Market Share'. A donut chart divides invented apps: ZipRide 41% (green), CityHop 29% (yellow), GoCab 18% (blue), FleetGo 7% (purple), Others 5% (grey). Center reads '2.8B rides/yr'. A legend with car-pin color chips and percentages, plus three mini tiles: 'Fastest grower: CityHop +6pts', 'Avg fare $12.40', 'Cities served 640'. Clean white background, flat design, map-route line motifs faintly in the background, rounded widgets, modern mobility data-report aesthetic, bold headline.Come usare
- Copia tutto il prompt originale, inclusi i parametri.
- Adatta soggetto, testo e composizione alle tue esigenze.
- Usa uno strumento esterno compatibile; verifica accesso e risultato.
Prima di iniziare
- Controlla se serve un’immagine di riferimento. La compatibilità non prova il modello usato per l’esempio.
- Verifica nomi, numeri e testi; i risultati cambiano con le versioni del modello.