Original document
GPT Image 2 · en
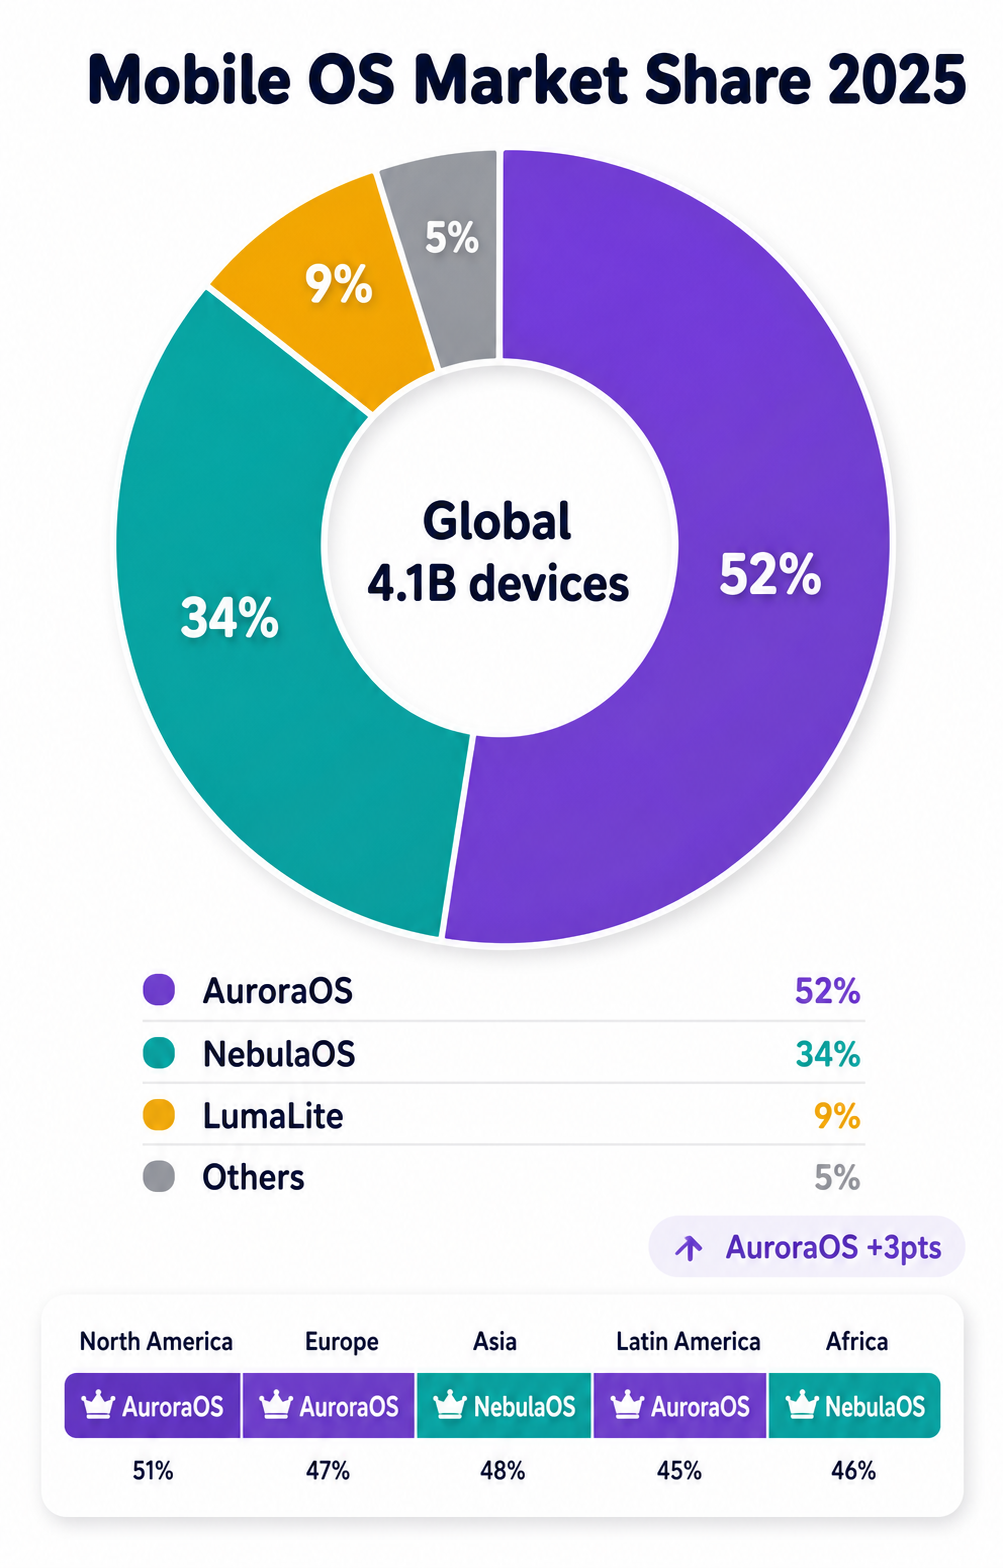
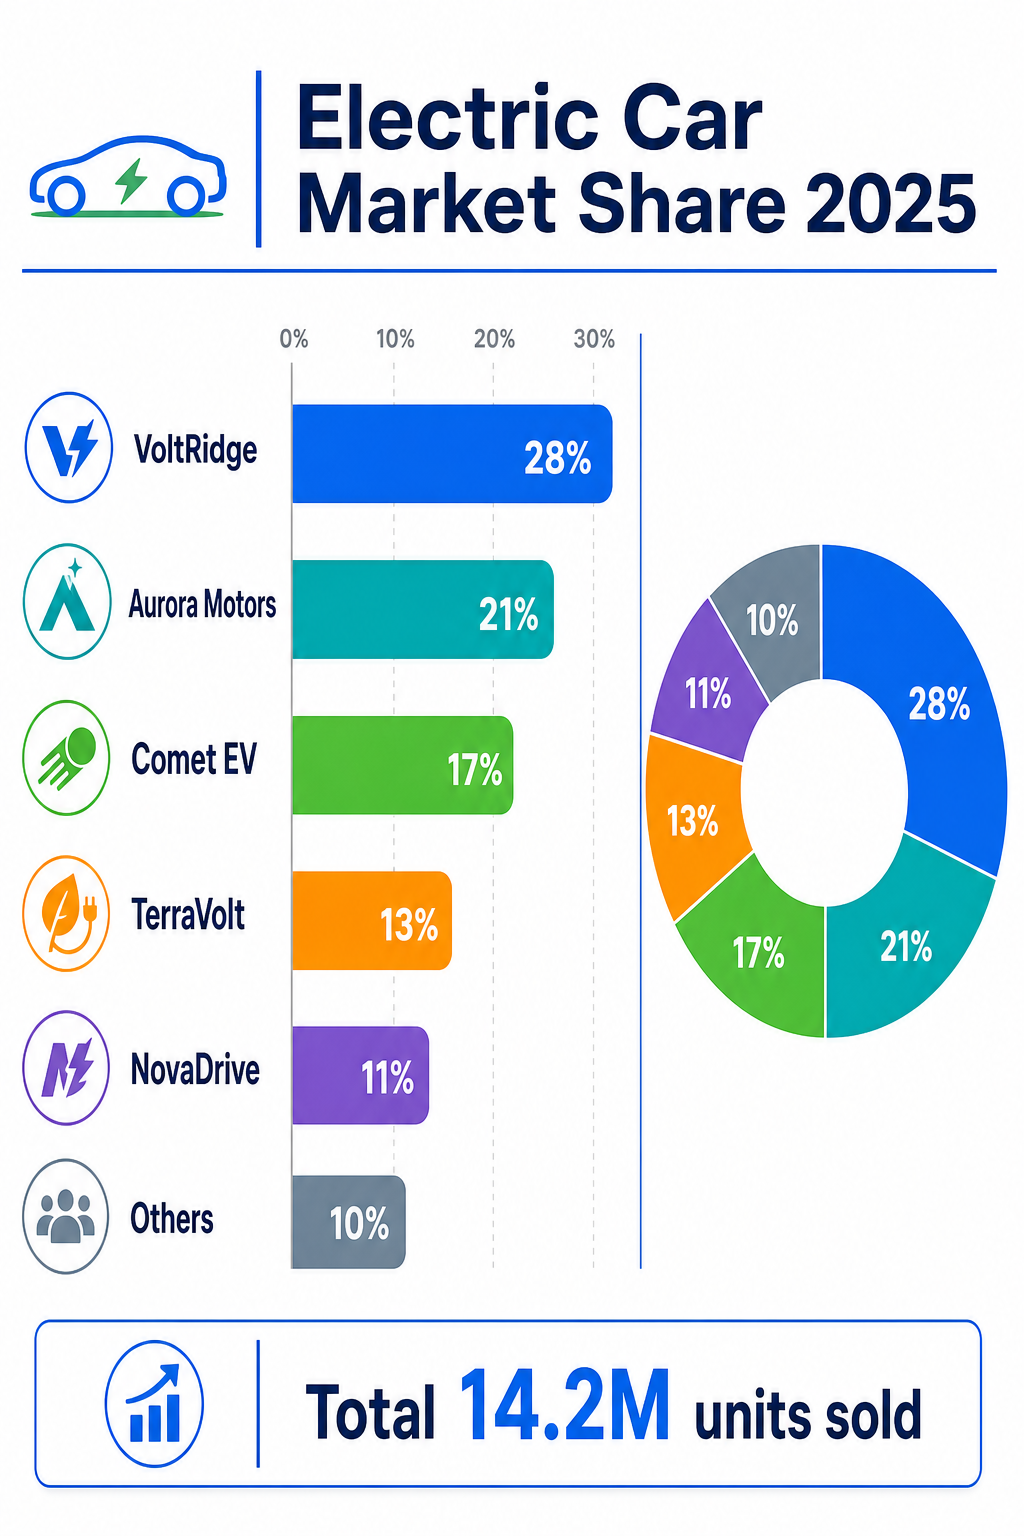
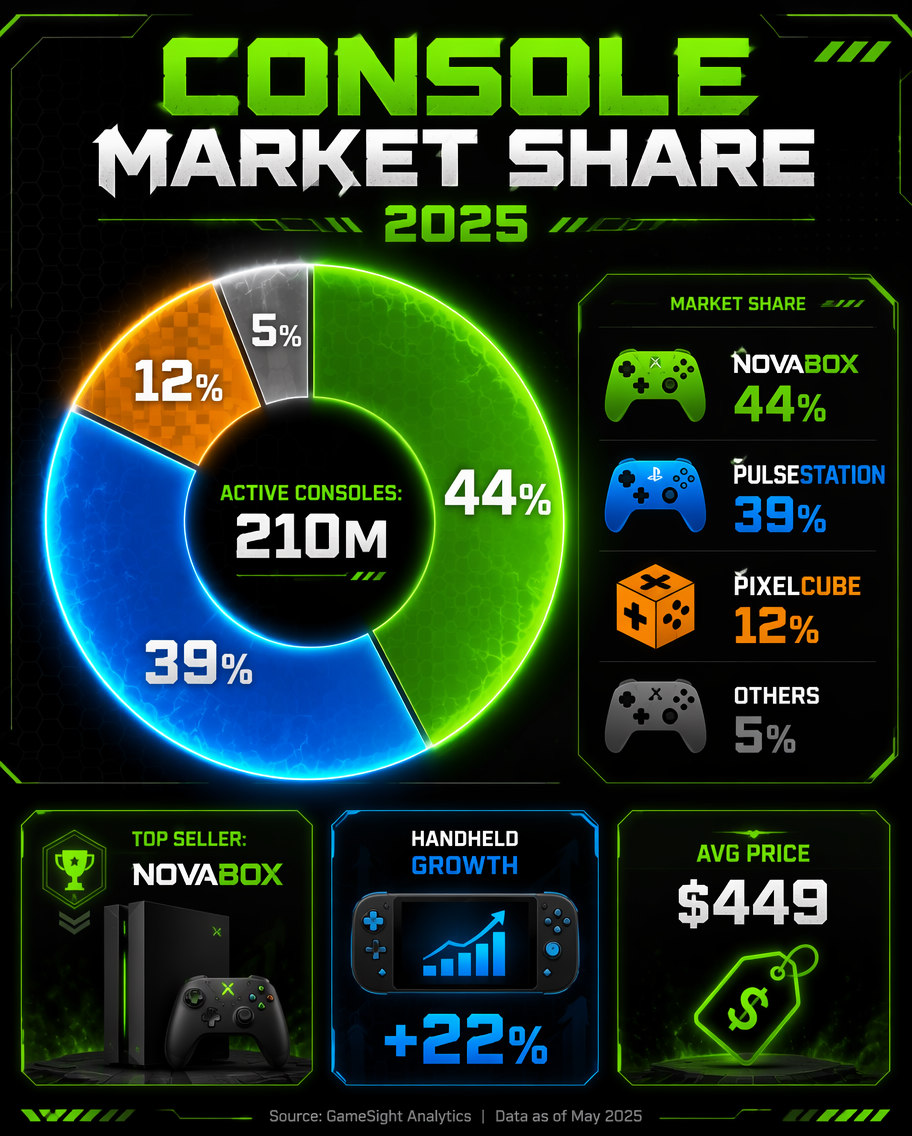
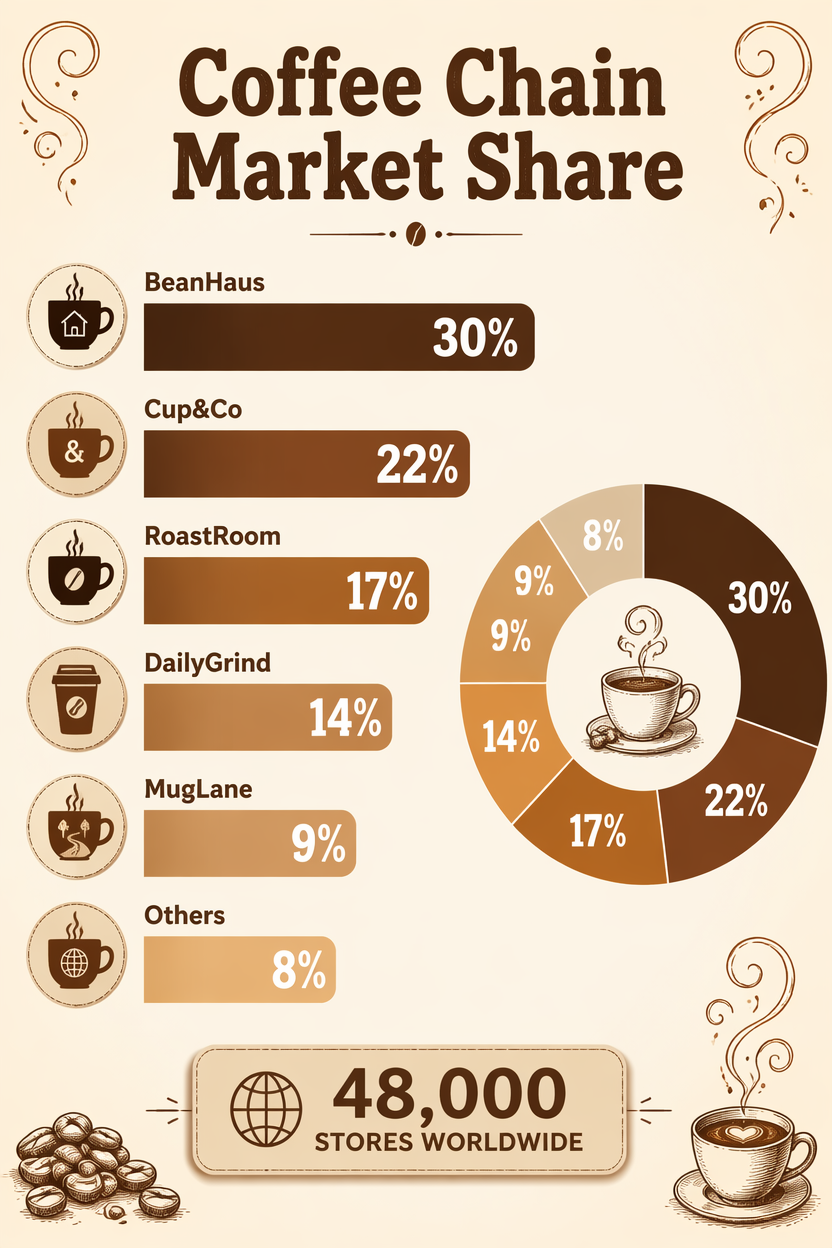
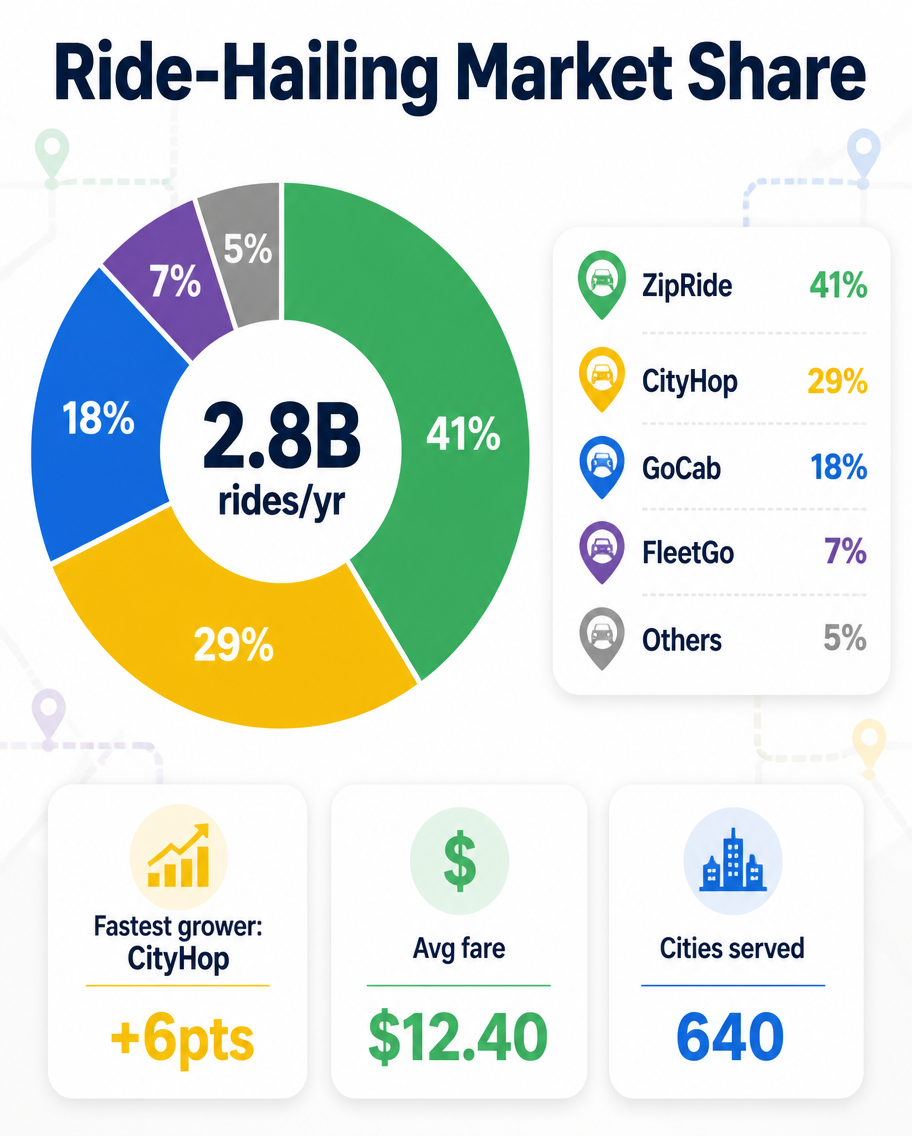
A mobility market-share infographic, 4:5, titled 'Ride-Hailing Market Share'. A donut chart divides invented apps: ZipRide 41% (green), CityHop 29% (yellow), GoCab 18% (blue), FleetGo 7% (purple), Others 5% (grey). Center reads '2.8B rides/yr'. A legend with car-pin color chips and percentages, plus three mini tiles: 'Fastest grower: CityHop +6pts', 'Avg fare $12.40', 'Cities served 640'. Clean white background, flat design, map-route line motifs faintly in the background, rounded widgets, modern mobility data-report aesthetic, bold headline.How to use
- Copy the complete original prompt, including any parameters.
- Replace the subject, text and composition with your own requirements.
- Use a compatible external tool; check its current access conditions and review the result.
Before you start
- Check whether a reference image is required. A compatible model label does not mean this example was generated with that model.
- Keep names, figures and visible text accurate; results can vary between model versions.