Documento originale
GPT Image 2 · en
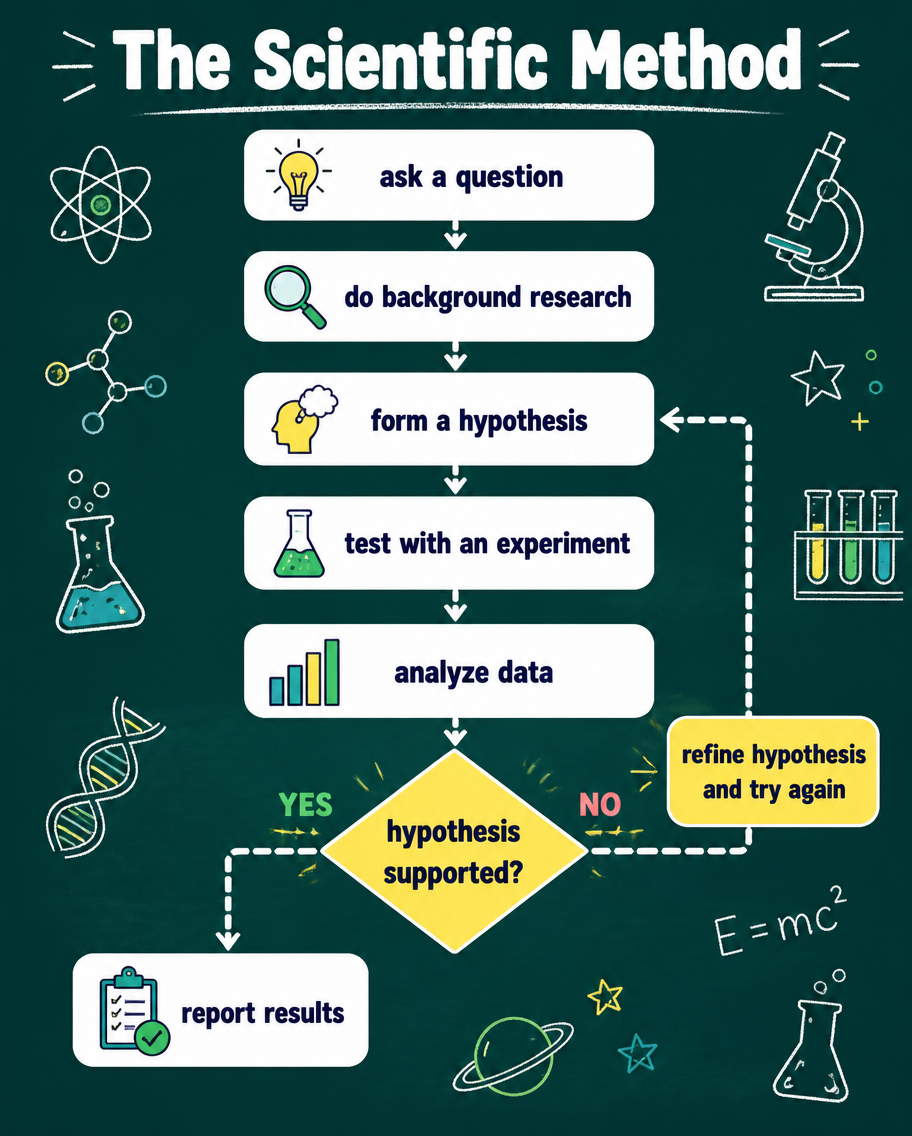
An education flowchart infographic of the scientific method drawn as a top-to-bottom decision diagram. Rounded boxes read 'ask a question', 'do background research', 'form a hypothesis', 'test with an experiment', 'analyze data', then a decision diamond 'hypothesis supported?' branching to 'report results' or looping back to refine. Crisp flat vector, a chalkboard-teal background with white and lemon-yellow nodes, playful science icons (flask, magnifier, lightbulb). Bold title 'The Scientific Method' at the top, dashed arrows between steps.Come usare
- Copia tutto il prompt originale, inclusi i parametri.
- Adatta soggetto, testo e composizione alle tue esigenze.
- Usa uno strumento esterno compatibile; verifica accesso e risultato.
Prima di iniziare
- Controlla se serve un’immagine di riferimento. La compatibilità non prova il modello usato per l’esempio.
- Verifica nomi, numeri e testi; i risultati cambiano con le versioni del modello.