原始文档
GPT Image 2 · en
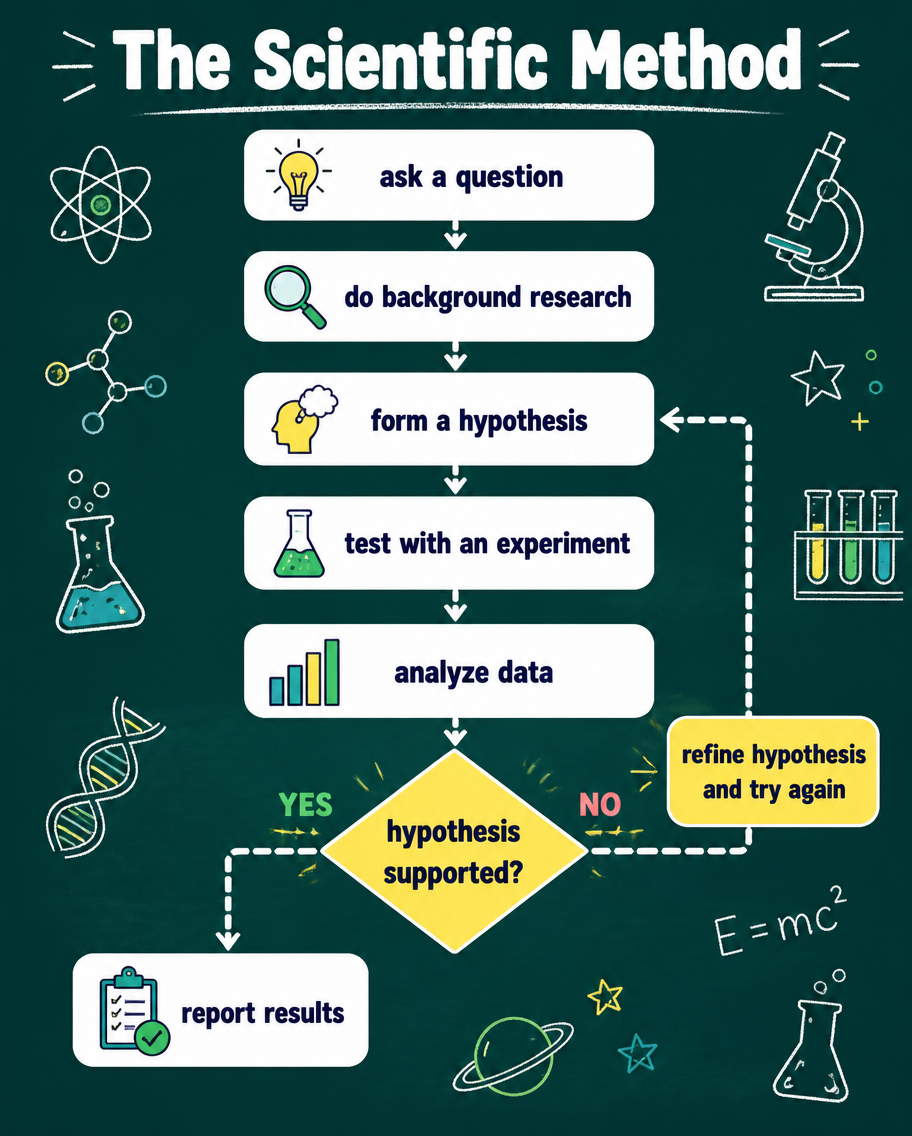
An education flowchart infographic of the scientific method drawn as a top-to-bottom decision diagram. Rounded boxes read 'ask a question', 'do background research', 'form a hypothesis', 'test with an experiment', 'analyze data', then a decision diamond 'hypothesis supported?' branching to 'report results' or looping back to refine. Crisp flat vector, a chalkboard-teal background with white and lemon-yellow nodes, playful science icons (flask, magnifier, lightbulb). Bold title 'The Scientific Method' at the top, dashed arrows between steps.使用方法
- 复制完整原始提示词,并保留其中的参数。
- 按需求替换主体、文字和构图要求。
- 在兼容的外部工具中使用,核对当前使用条件并检查结果。
开始前需了解
- 先确认是否需要参考图。标注兼容模型,不代表该示例由这个模型生成。
- 核对名称、数字与画面文字;不同模型版本的结果可能不同。