Documento originale
GPT Image 2 · en
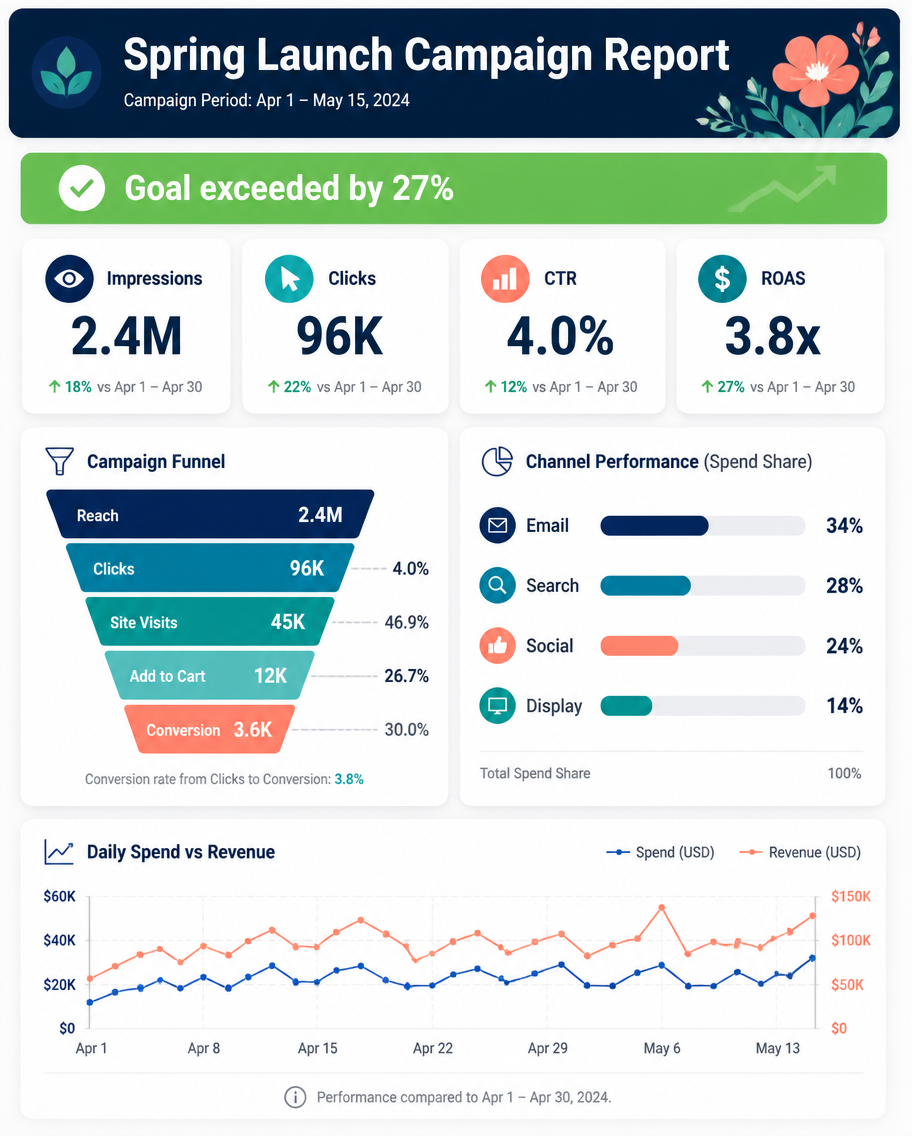
A dashboard infographic, 4:5, titled 'Spring Launch Campaign Report'. A results slide with four KPI tiles: Impressions 2.4M, Clicks 96K, CTR 4.0%, ROAS 3.8x. A funnel chart narrows from Reach to Conversion, a channel-split bar compares Email 34%, Search 28%, Social 24%, Display 14%, and a small line shows daily spend vs revenue. A green highlight banner 'Goal exceeded by 27%'. Clean corporate palette of navy, teal, and coral, rounded widgets on a light grid, soft shadows, polished professional report-slide aesthetic, crisp sans-serif.Come usare
- Copia tutto il prompt originale, inclusi i parametri.
- Adatta soggetto, testo e composizione alle tue esigenze.
- Usa uno strumento esterno compatibile; verifica accesso e risultato.
Prima di iniziare
- Controlla se serve un’immagine di riferimento. La compatibilità non prova il modello usato per l’esempio.
- Verifica nomi, numeri e testi; i risultati cambiano con le versioni del modello.