Original document
GPT Image 2 · en
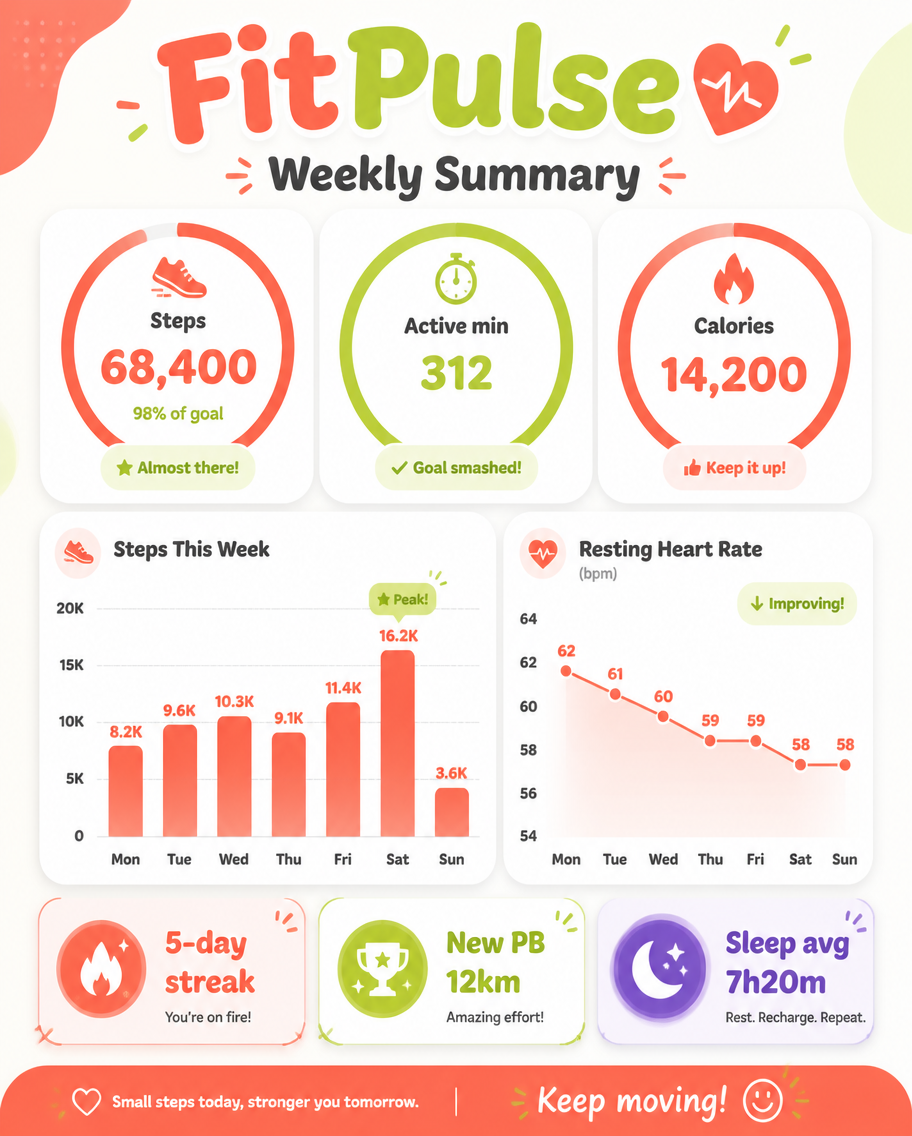
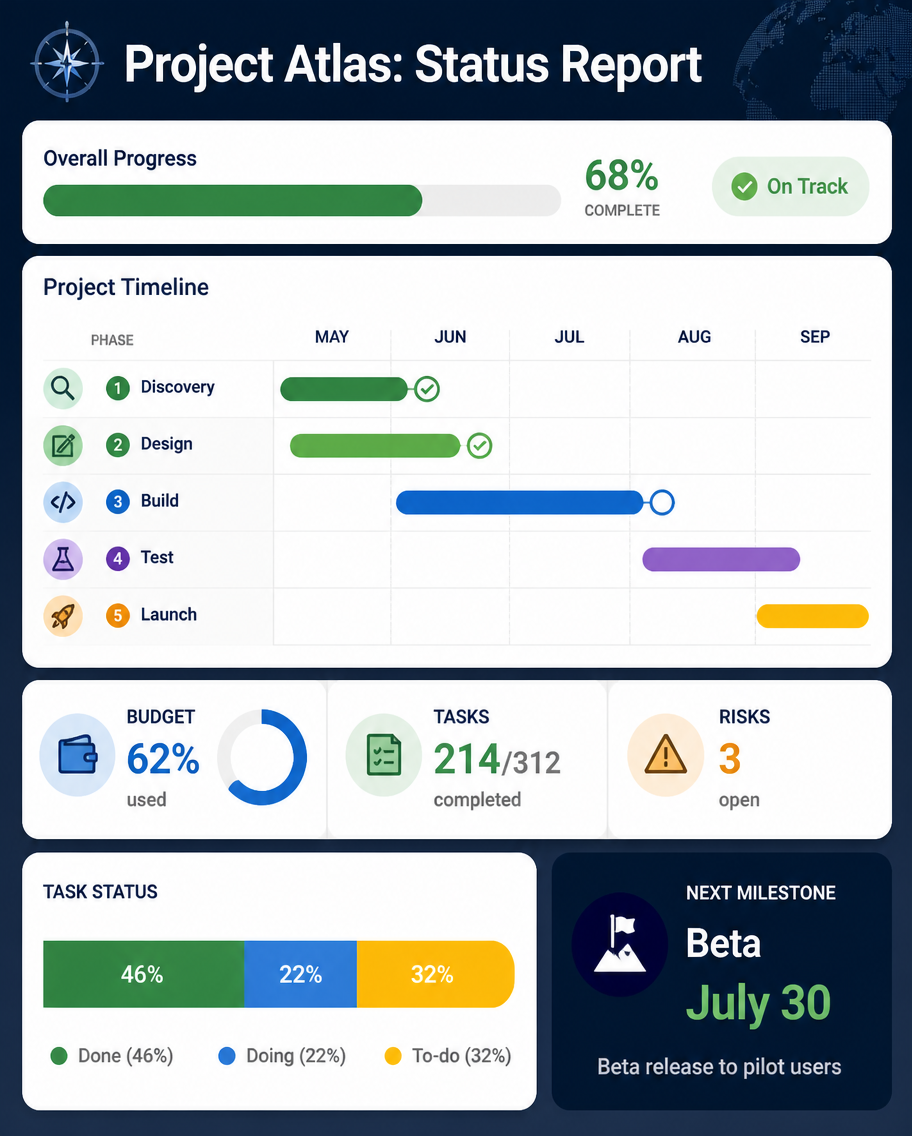
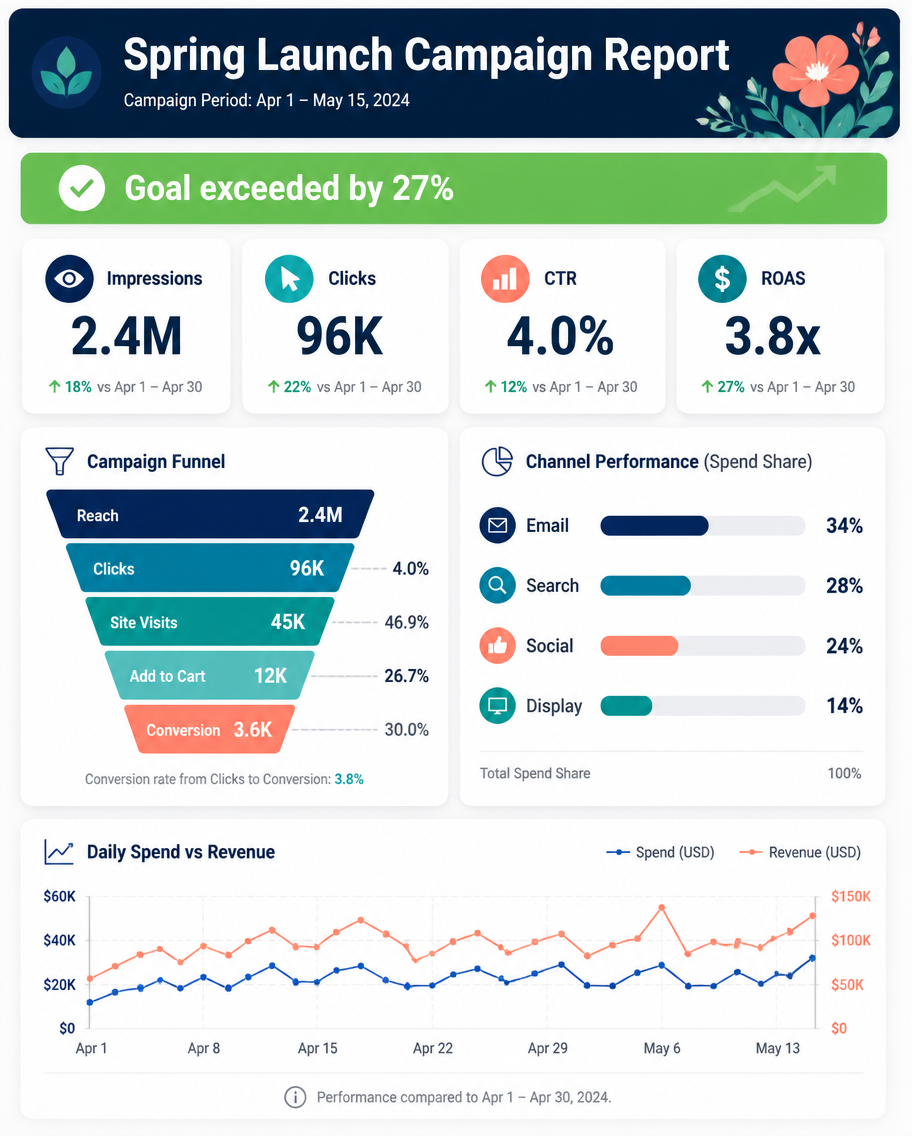
A dashboard infographic, 4:5, titled 'Spring Launch Campaign Report'. A results slide with four KPI tiles: Impressions 2.4M, Clicks 96K, CTR 4.0%, ROAS 3.8x. A funnel chart narrows from Reach to Conversion, a channel-split bar compares Email 34%, Search 28%, Social 24%, Display 14%, and a small line shows daily spend vs revenue. A green highlight banner 'Goal exceeded by 27%'. Clean corporate palette of navy, teal, and coral, rounded widgets on a light grid, soft shadows, polished professional report-slide aesthetic, crisp sans-serif.How to use
- Copy the complete original prompt, including any parameters.
- Replace the subject, text and composition with your own requirements.
- Use a compatible external tool; check its current access conditions and review the result.
Before you start
- Check whether a reference image is required. A compatible model label does not mean this example was generated with that model.
- Keep names, figures and visible text accurate; results can vary between model versions.