Documento originale
GPT Image 2 · en
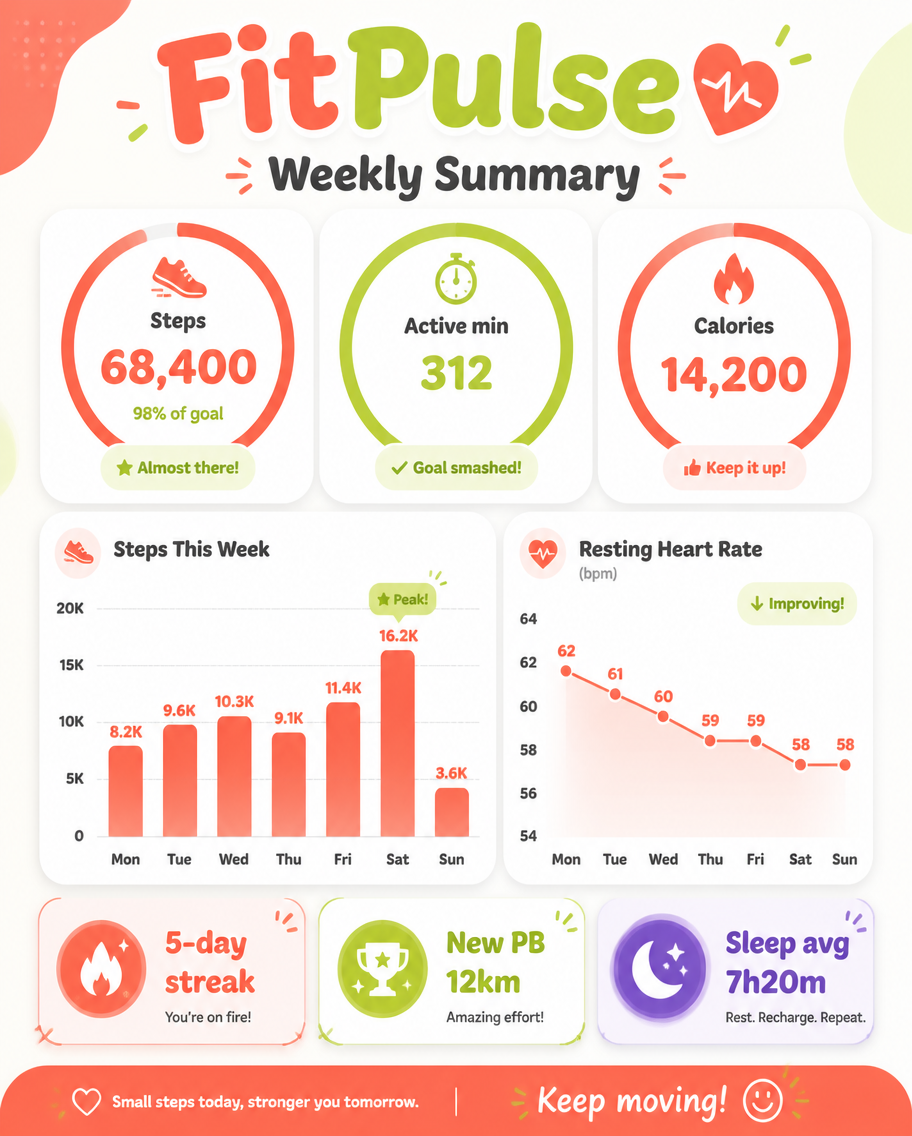
A dashboard infographic, 4:5, titled 'FitPulse Weekly Summary'. A friendly report slide: a top ring-chart trio shows Steps 68,400 (98% of goal), Active min 312, Calories 14,200. A weekly bar chart plots steps Mon-Sun peaking Saturday, a small line shows resting heart rate trending down 62-58 bpm, and three badge chips: '5-day streak', 'New PB 12km', 'Sleep avg 7h20m'. Energetic coral, lime, and white palette, rounded progress rings, soft shadows, motivating clean fitness-app dashboard aesthetic, bubbly headings.Come usare
- Copia tutto il prompt originale, inclusi i parametri.
- Adatta soggetto, testo e composizione alle tue esigenze.
- Usa uno strumento esterno compatibile; verifica accesso e risultato.
Prima di iniziare
- Controlla se serve un’immagine di riferimento. La compatibilità non prova il modello usato per l’esempio.
- Verifica nomi, numeri e testi; i risultati cambiano con le versioni del modello.