원본 문서
GPT Image 2 · en
{
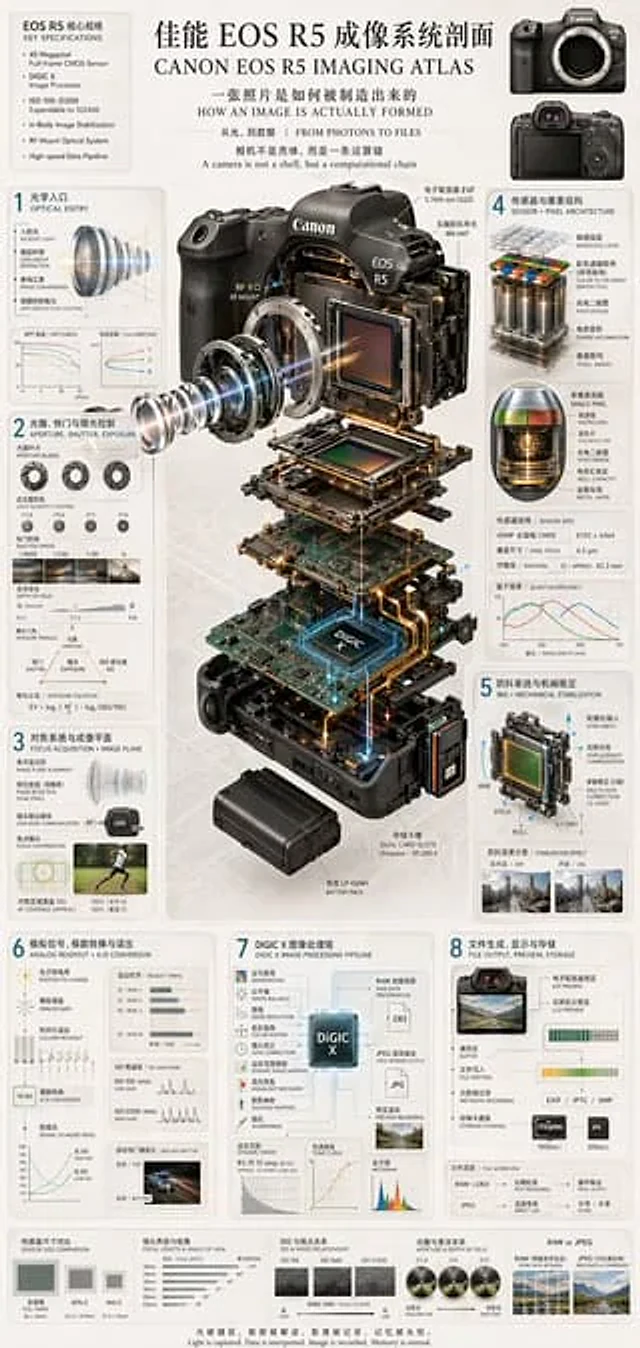
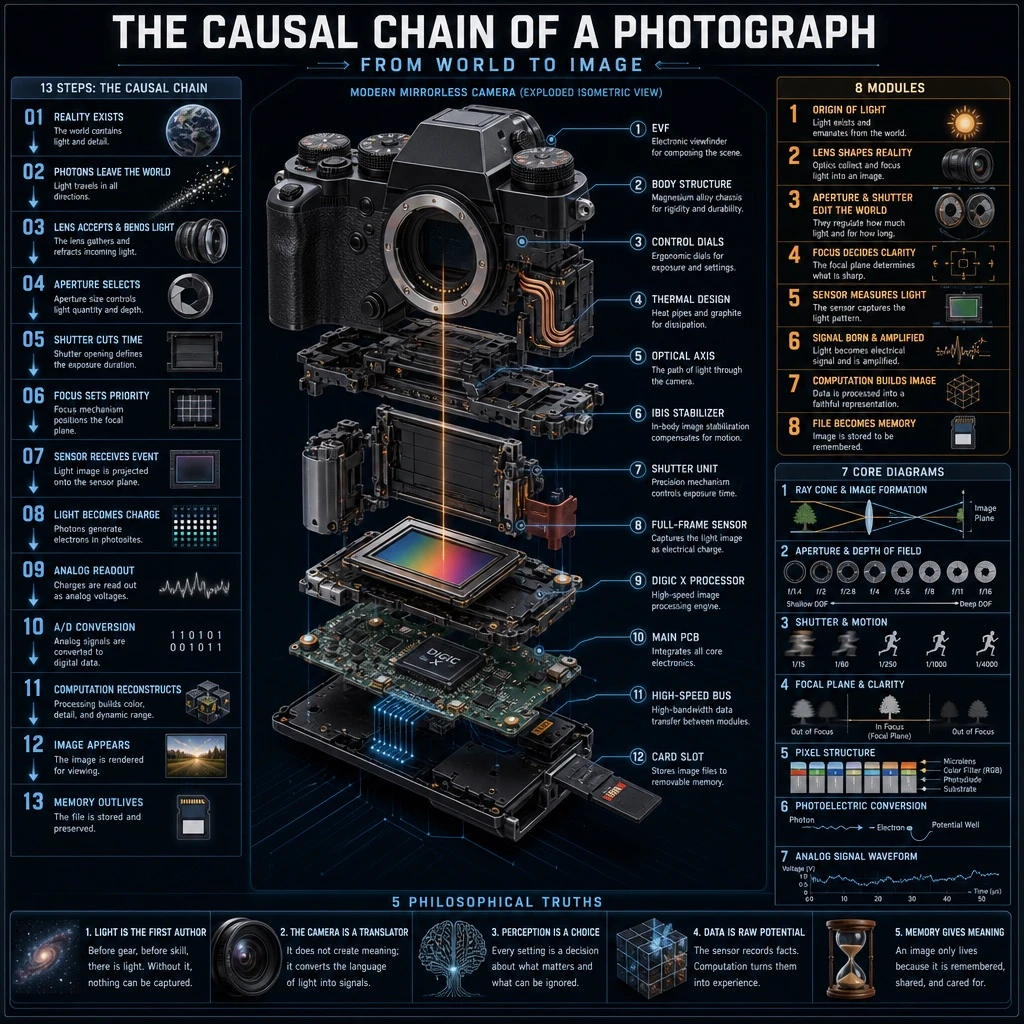
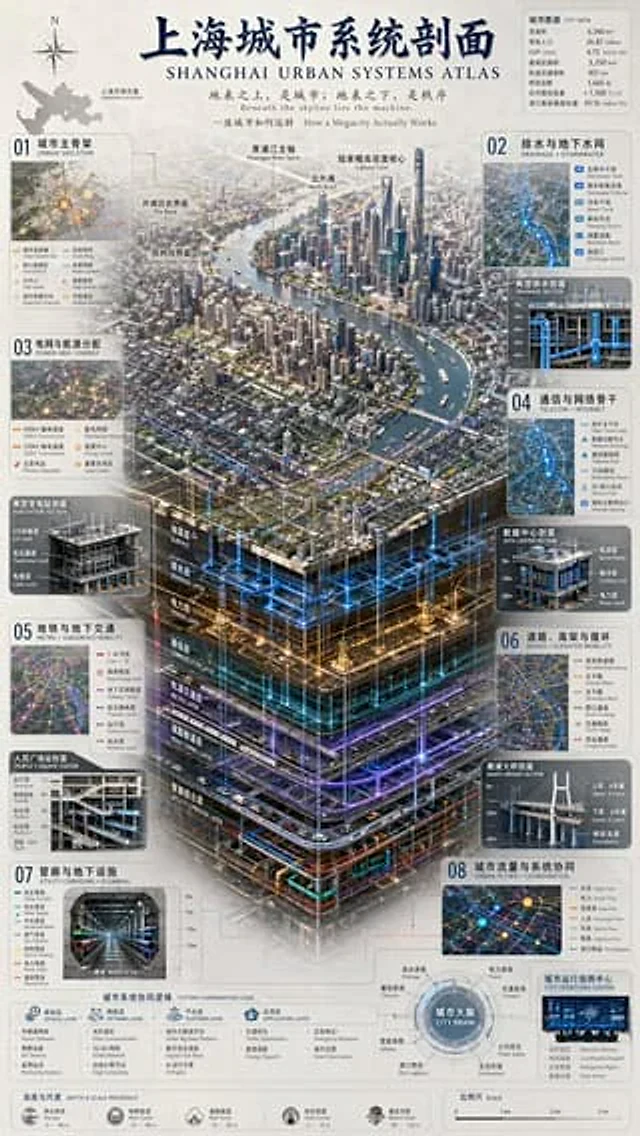
  "type": "Complex Urban Systems Atlas Infographic",
  "style": "{argument name=\"color palette\" default=\"Dark background with luminous blue, gold, and purple accents.\"} Highly detailed technical illustrations, 3D isometric sections",
  "header": {
    "title": "{argument name=\"chinese city name\" default=\"Shanghai\"} Urban System Profile{argument name=\"english city name\" default=\"SHANGHAI\"} URBAN SYSTEMS ATLAS",
    "subtitles": [
      "Above the earth's surface lies the city; beneath the earth lies order.{argument name=\"english subtitle\" default=\"Beneath the skyline lies the machine.\"}",
      "How a Megacity Actually Works"
    ]
  },
  "layout": {
    "top_left": "Compass rose and city map labeled \"Shanghai Location\"",
    "top_right": "The data table titled \"CITY DATA\" contains 7 rows of statistical information.",
    "centerpiece": {
      "description": "{argument name=\"centerpiece style\" default=\"Highly detailed 3D isometric section rendering\"} Showcasing the river landscape of the metropolis",
      "layers": [
        "Surface",
        "Drainage Layer",
        "Power Layer",
        "Communication Layer",
        "Metro Layer",
        "Road tunnel layer",
        "Utility Corridor Layer"
      ]
    },
    "side_panels": [
      {
        "id": "01",
        "title": "Urban Skeleton, the main urban framework",
        "elements": "Map containing 8 legend items"
      },
      {
        "id": "02",
        "title": "Drainage and groundwater network",
        "elements": "The cross-sectional view “Typical Drainage Section” contains 5 legend items."
      },
      {
        "id": "03",
        "title": "Power grid and energy distribution",
        "elements": "The cross-sectional view \"Typical Substation Profile\" contains 6 legend items."
      },
      {
        "id": "04",
        "title": "Telecommunications and Network Backbone TELECOM + INTERNET",
        "elements": "The cross-sectional view, \"DATA CENTER SECTION,\" contains 6 legend items."
      },
      {
        "id": "05",
        "title": "Metro and Subsurface Mobility",
        "elements": "The cross-sectional view \"People's Square Station\" contains 6 legend items."
      },
      {
        "id": "06",
        "title": "Roads, Elevated Roads and Circulations + ELEVATED MOBILITY",
        "elements": "The cross-sectional view \"NANPU BRIDGE SECTION\" contains 6 legend items."
      },
      {
        "id": "07",
        "title": "Utility Corridors and Plumbing",
        "elements": "The cross-sectional view of \"UTILITY CORRIDOR\" contains 8 legend items."
      },
      {
        "id": "08",
        "title": "Urban flow and system coordination",
        "elements": "The map chart \"CITY OPERATIONS CENTER\" contains 6 legend items."
      }
    ],
    "bottom_panels": {
      "system_logic": {
        "title": "Urban System Coordination Logic",
        "steps": 4,
        "labels": [
          "Sensing Layer",
          "Network Layer",
          "Platform Layer",
          "Application Layer"
        ]
      },
      "city_brain": {
        "title": "City Brain",
        "central_node": 1,
        "peripheral_nodes": 8
      },
      "references": {
        "depth_scale": {
          "title": "Depth & Scale Reference",
          "icons": 5
        },
        "map_scale": {
          "title": "Scale",
          "markers": 4
        }
      }
    }
  }
}
사용 방법
- 매개변수를 포함한 전체 원본 프롬프트를 복사하세요.
- 주제, 문구, 구도를 자신의 요구에 맞게 바꾸세요.
- 호환되는 외부 도구에서 사용하고 이용 조건과 결과를 확인하세요.
시작 전 확인
- 참조 이미지가 필요한지 확인하세요. 호환 표시는 해당 모델로 이 예시를 생성했다는 뜻이 아닙니다.
- 이름, 수치, 이미지 속 문구를 확인하세요. 모델 버전에 따라 결과가 다를 수 있습니다.