원본 문서
GPT Image 2 · en
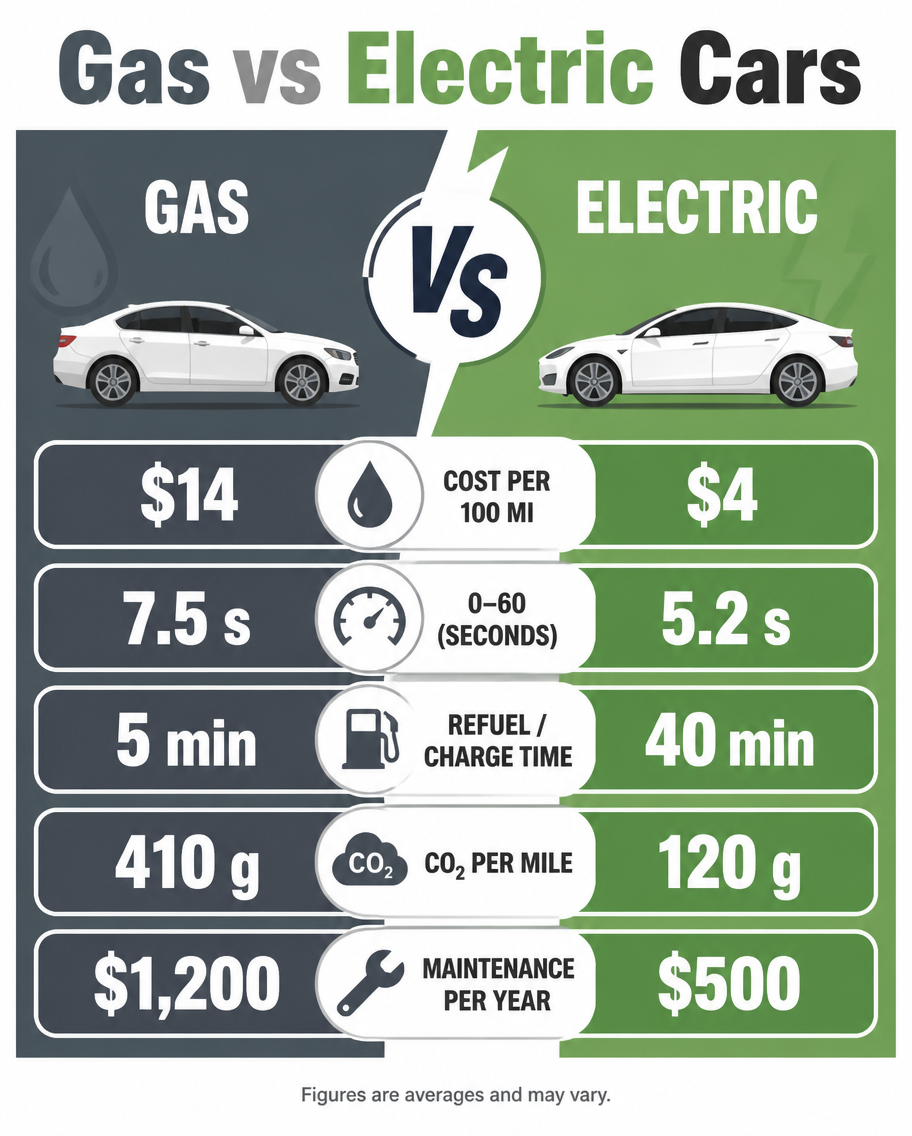
An auto versus infographic, 4:5, titled 'Gas vs Electric Cars'. A split screen: left slate-grey 'Gas', right green 'Electric', joined by a bold 'VS' emblem. Matched rows with icons: cost per 100 mi ($14 vs $4), 0-60 (7.5 vs 5.2 s), refuel/charge time (5 min vs 40 min), CO2 per mile (410g vs 120g), maintenance/yr ($1,200 vs $500). Small side-view car silhouettes top each half. Clean flat design, white background, fuel-drop and lightning-bolt motifs, rounded stat bars, balanced modern comparison aesthetic.사용 방법
- 매개변수를 포함한 전체 원본 프롬프트를 복사하세요.
- 주제, 문구, 구도를 자신의 요구에 맞게 바꾸세요.
- 호환되는 외부 도구에서 사용하고 이용 조건과 결과를 확인하세요.
시작 전 확인
- 참조 이미지가 필요한지 확인하세요. 호환 표시는 해당 모델로 이 예시를 생성했다는 뜻이 아닙니다.
- 이름, 수치, 이미지 속 문구를 확인하세요. 모델 버전에 따라 결과가 다를 수 있습니다.