Original document
GPT Image 2 · en
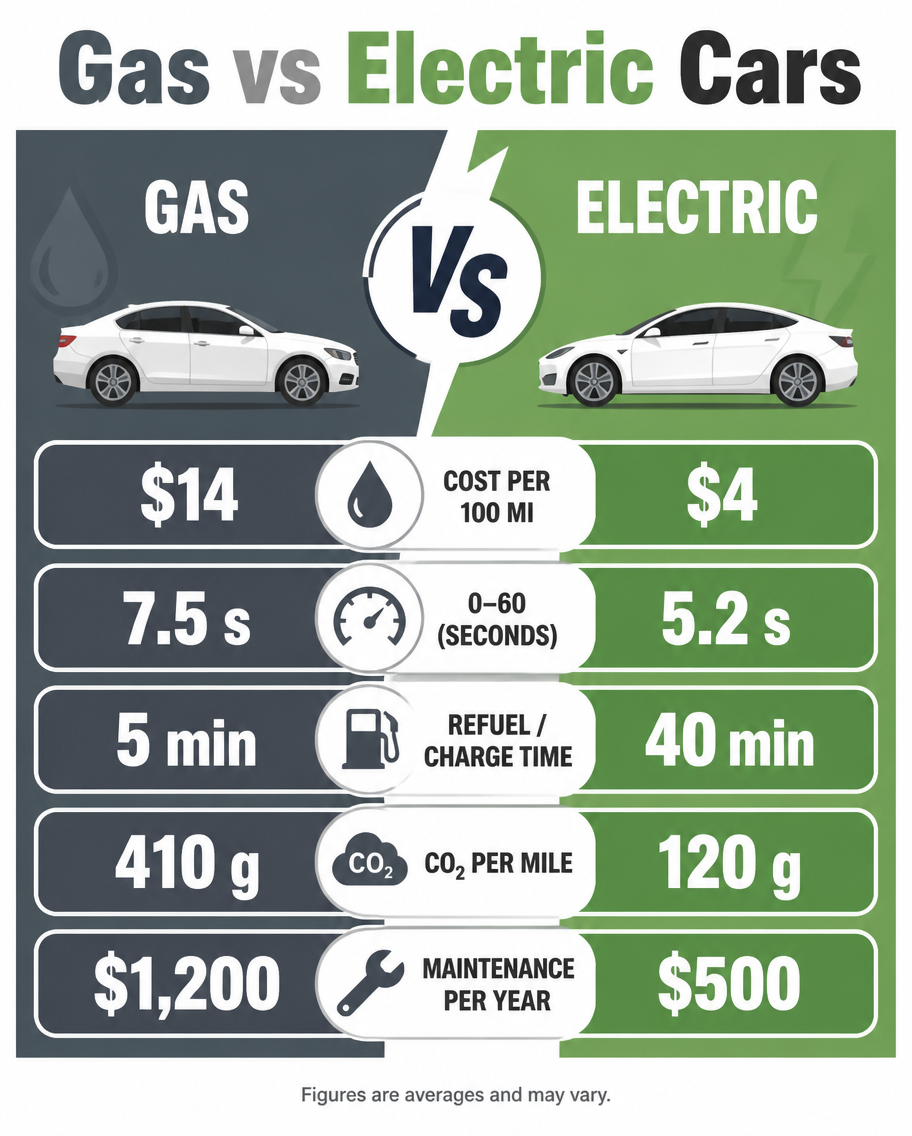
An auto versus infographic, 4:5, titled 'Gas vs Electric Cars'. A split screen: left slate-grey 'Gas', right green 'Electric', joined by a bold 'VS' emblem. Matched rows with icons: cost per 100 mi ($14 vs $4), 0-60 (7.5 vs 5.2 s), refuel/charge time (5 min vs 40 min), CO2 per mile (410g vs 120g), maintenance/yr ($1,200 vs $500). Small side-view car silhouettes top each half. Clean flat design, white background, fuel-drop and lightning-bolt motifs, rounded stat bars, balanced modern comparison aesthetic.How to use
- Copy the complete original prompt, including any parameters.
- Replace the subject, text and composition with your own requirements.
- Use a compatible external tool; check its current access conditions and review the result.
Before you start
- Check whether a reference image is required. A compatible model label does not mean this example was generated with that model.
- Keep names, figures and visible text accurate; results can vary between model versions.