원본 문서
GPT Image 2 · en
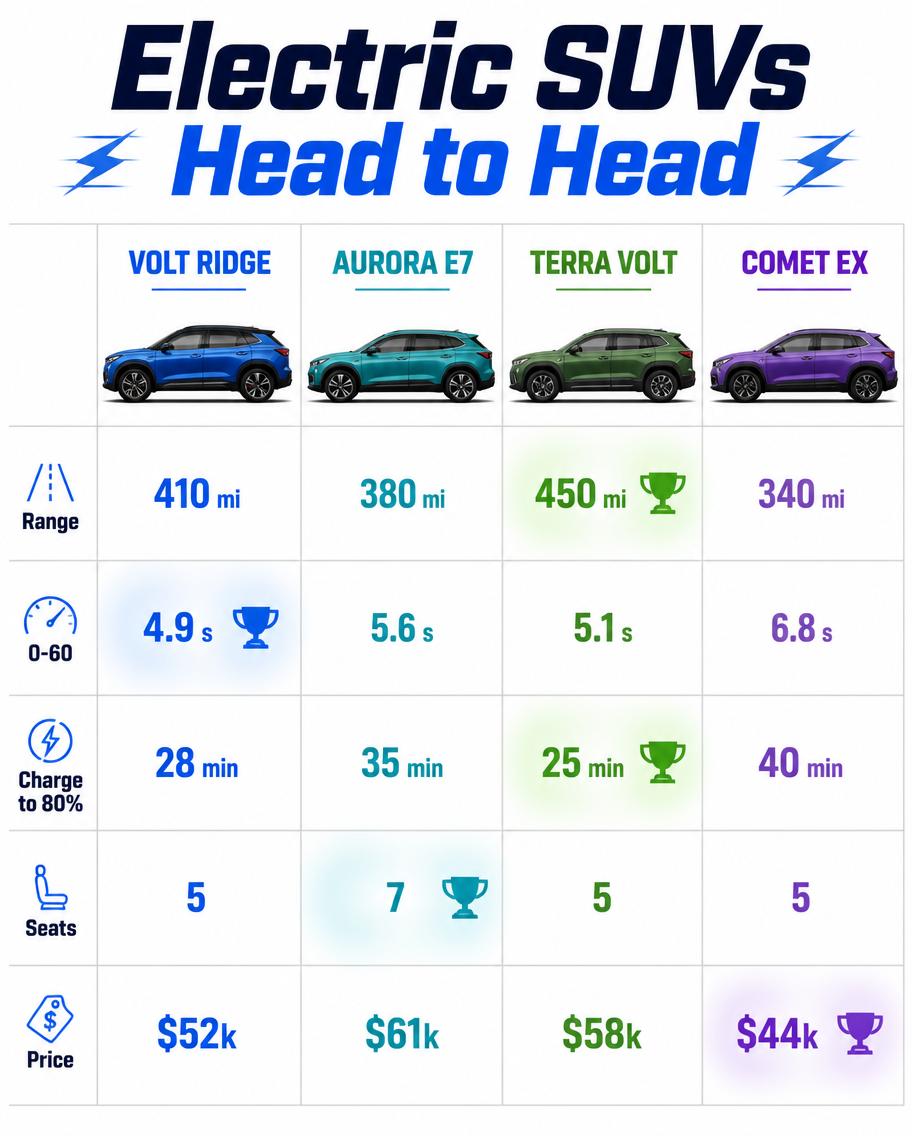
A vehicle comparison infographic, 4:5, titled 'Electric SUVs Head to Head'. A four-column table for invented EVs: Volt Ridge, Aurora E7, Terra Volt, Comet EX. Side-profile car illustrations top each column in matching accent colors. Rows: Range (410 vs 380 vs 450 vs 340 mi), 0-60 (4.9 vs 5.6 vs 5.1 vs 6.8 s), Charge to 80% (28 vs 35 vs 25 vs 40 min), Seats (5 vs 7 vs 5 vs 5), Price ($52k vs $61k vs $58k vs $44k). Best-in-row values glow with a small trophy icon. Clean white background, electric-blue and green palette, bold headers, sharp modern typography.사용 방법
- 매개변수를 포함한 전체 원본 프롬프트를 복사하세요.
- 주제, 문구, 구도를 자신의 요구에 맞게 바꾸세요.
- 호환되는 외부 도구에서 사용하고 이용 조건과 결과를 확인하세요.
시작 전 확인
- 참조 이미지가 필요한지 확인하세요. 호환 표시는 해당 모델로 이 예시를 생성했다는 뜻이 아닙니다.
- 이름, 수치, 이미지 속 문구를 확인하세요. 모델 버전에 따라 결과가 다를 수 있습니다.