Mobile OS Market Share

Mobile OS Market Share

Oryginalny dokument

GPT Image 2 · en

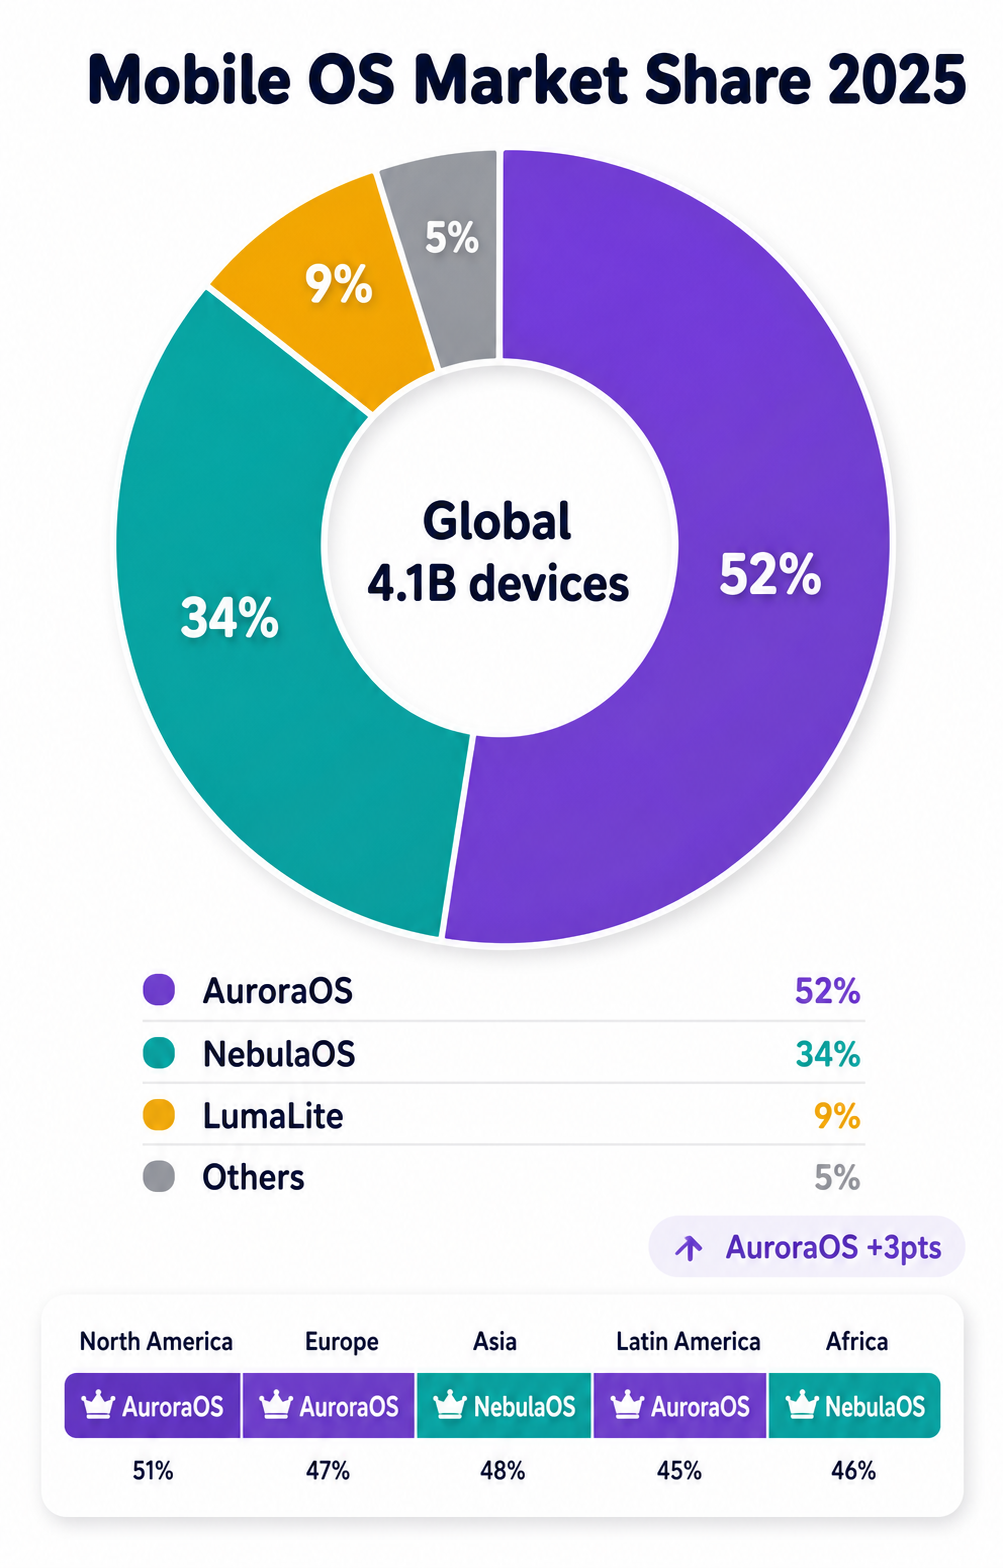
A market-share infographic, 4:5, titled 'Mobile OS Market Share 2025'. A large donut chart splits the market between invented systems: AuroraOS 52% (purple), NebulaOS 34% (teal), LumaLite 9% (amber), Others 5% (grey). The donut center reads 'Global 4.1B devices'. A legend with color dots and exact percentages sits below, plus a small year-over-year change note ('AuroraOS +3pts'). A tiny regional split bar shows differing leaders by continent. Clean white background, flat design, bold rounded headline, subtle shadows, modern data-report aesthetic.

Jak używać

  1. Skopiuj cały oryginalny prompt wraz z parametrami.
  2. Dostosuj temat, tekst i kompozycję do swoich potrzeb.
  3. Użyj zgodnego narzędzia zewnętrznego; sprawdź warunki dostępu i wynik.

Przed rozpoczęciem

  • Sprawdź, czy potrzebny jest obraz referencyjny. Zgodność nie potwierdza modelu użytego do przykładu.
  • Sprawdź nazwy, liczby i napisy; wyniki zależą od wersji modelu.
Podobne przykłady

Gaming Console Share
GPT Image 2en

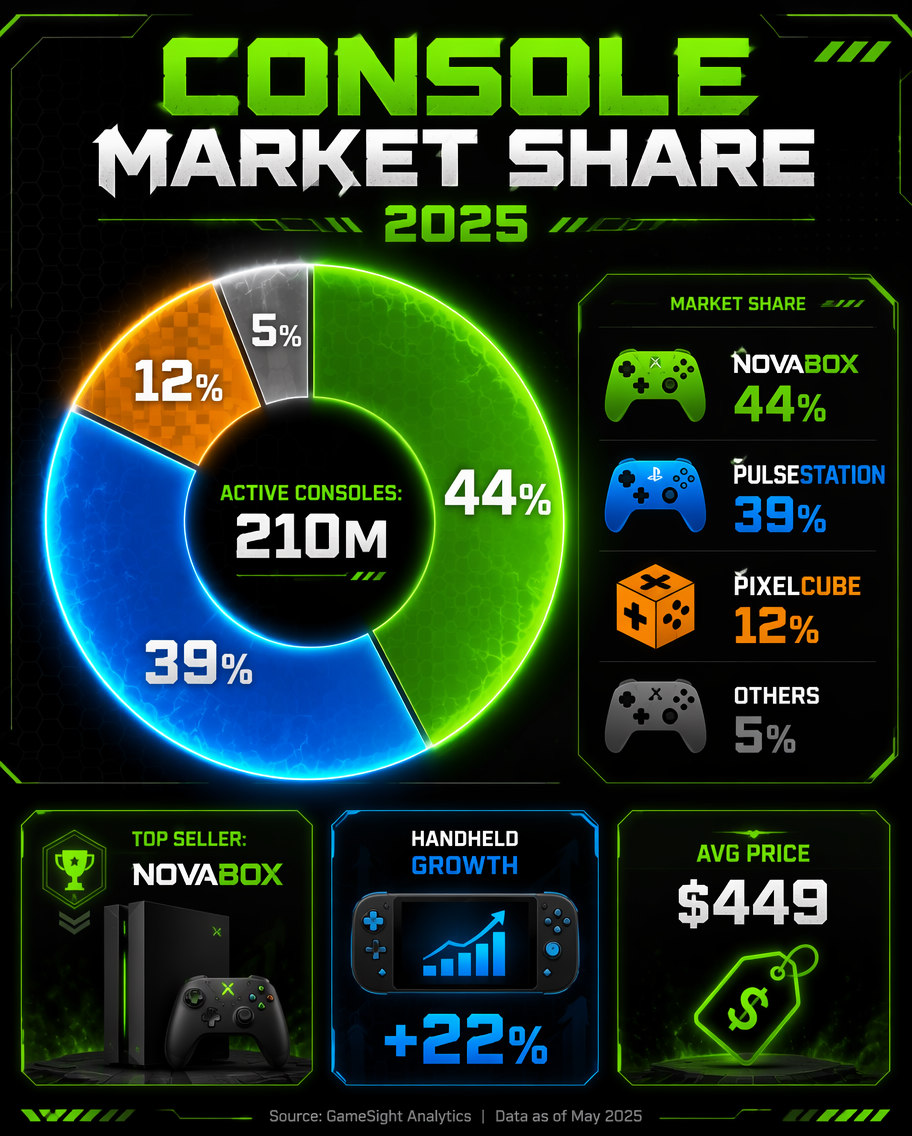
A gaming market-share infographic, 4:5, titled 'Console Market Share 2025'. A donut chart splits invented consoles: NovaBox 44% (green), PulseStation 39% (blue), PixelCube 12% (orange), Others 5% (grey). Center label 'Active consoles: 210M'. A legend with controller-shaped color

EV Brand Market Share
GPT Image 2en

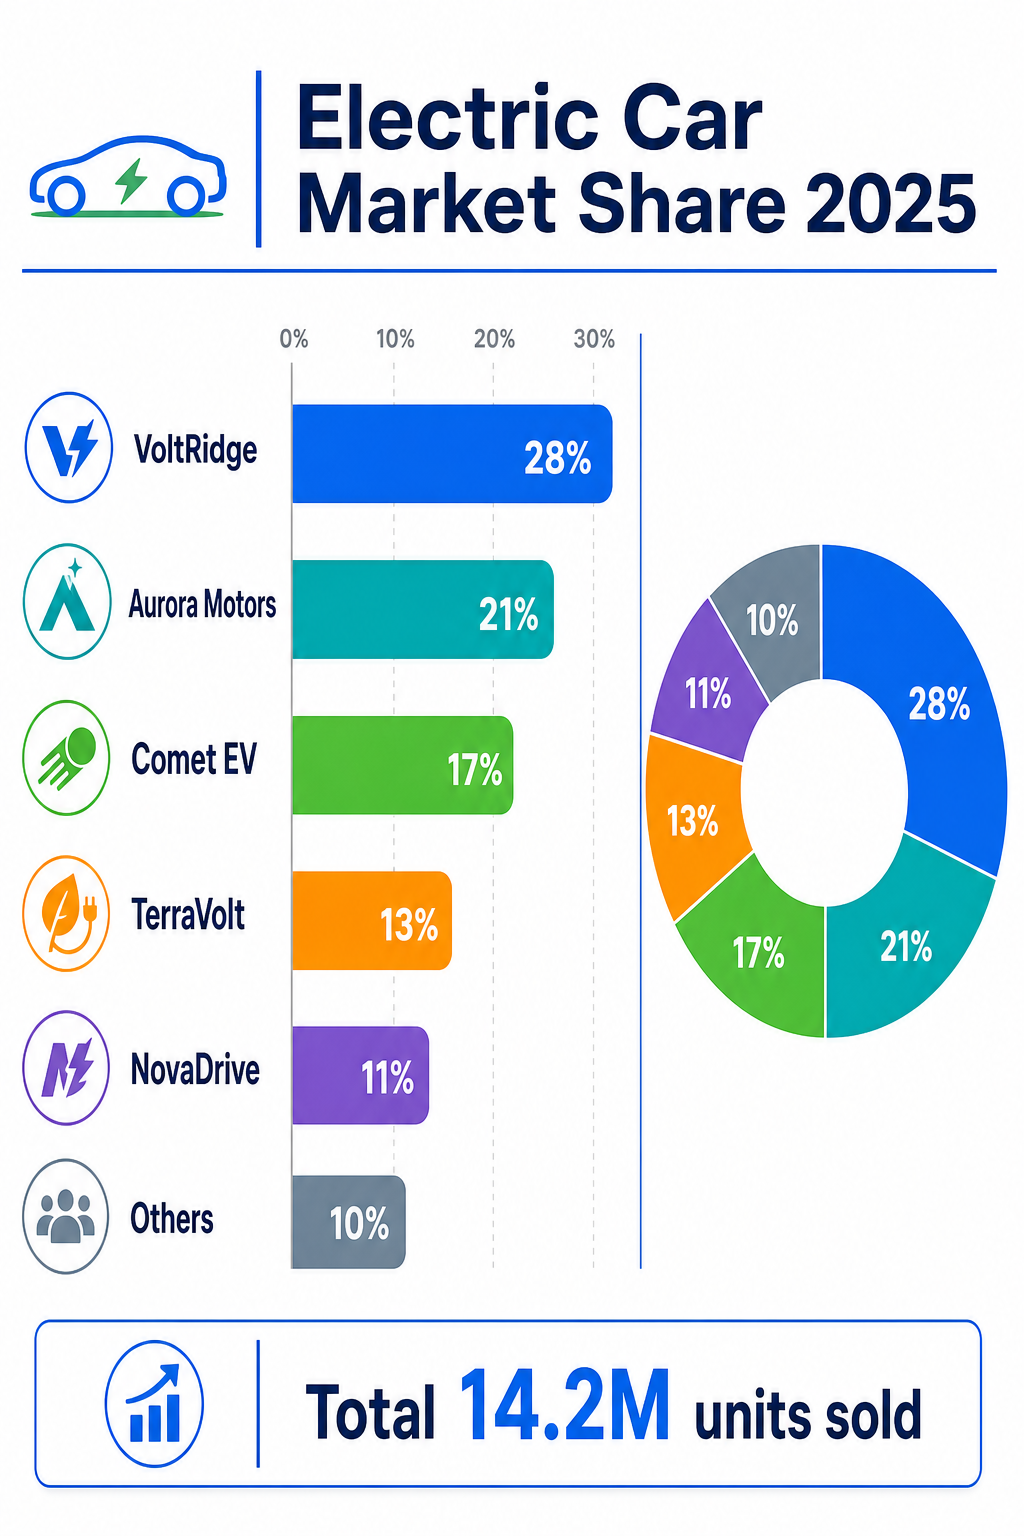
A market-share infographic, 2:3, titled 'Electric Car Market Share 2025'. A horizontal bar chart ranks invented EV makers: VoltRidge 28%, Aurora Motors 21%, Comet EV 17%, TerraVolt 13%, NovaDrive 11%, Others 10%, each bar in a distinct color with the percentage in bold. Small car

Ride-Hailing Market Share
GPT Image 2en

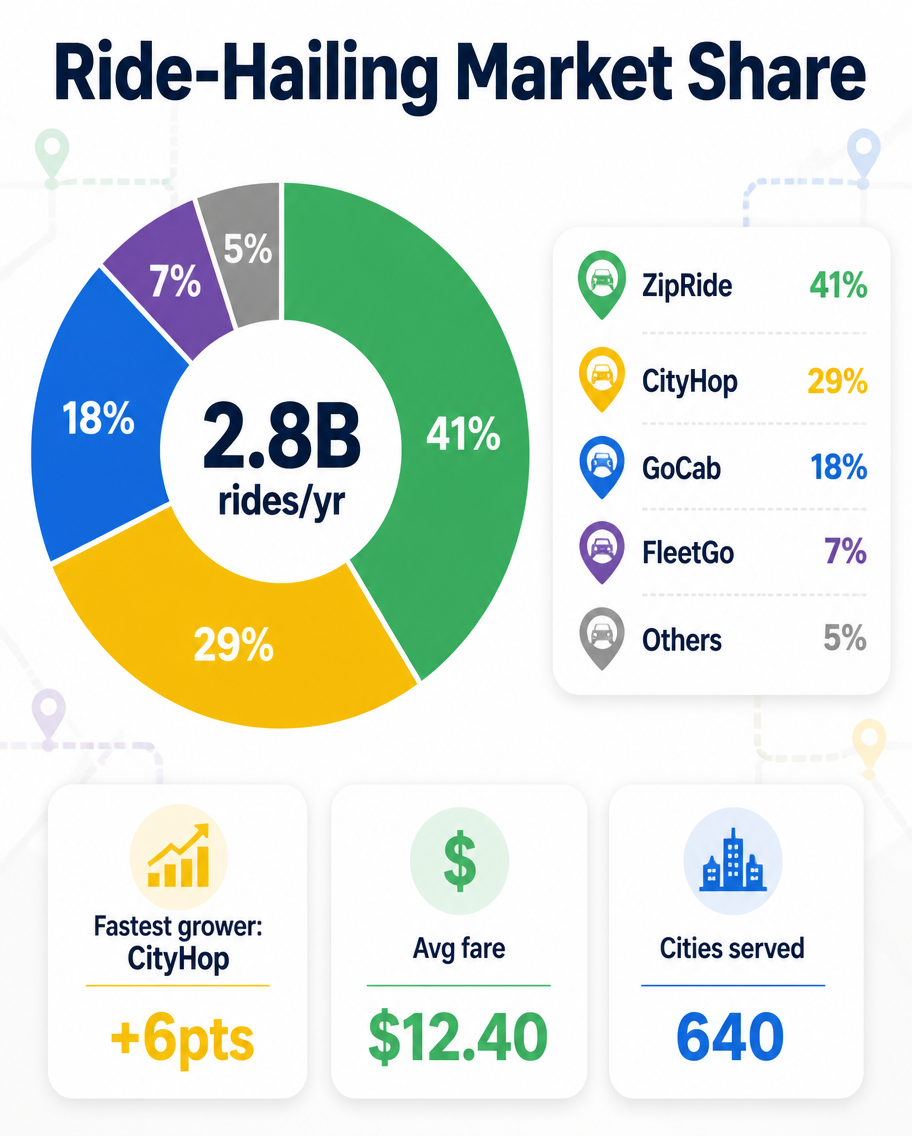
A mobility market-share infographic, 4:5, titled 'Ride-Hailing Market Share'. A donut chart divides invented apps: ZipRide 41% (green), CityHop 29% (yellow), GoCab 18% (blue), FleetGo 7% (purple), Others 5% (grey). Center reads '2.8B rides/yr'. A legend with car-pin color chips a

Social Platform Market Share
GPT Image 2en

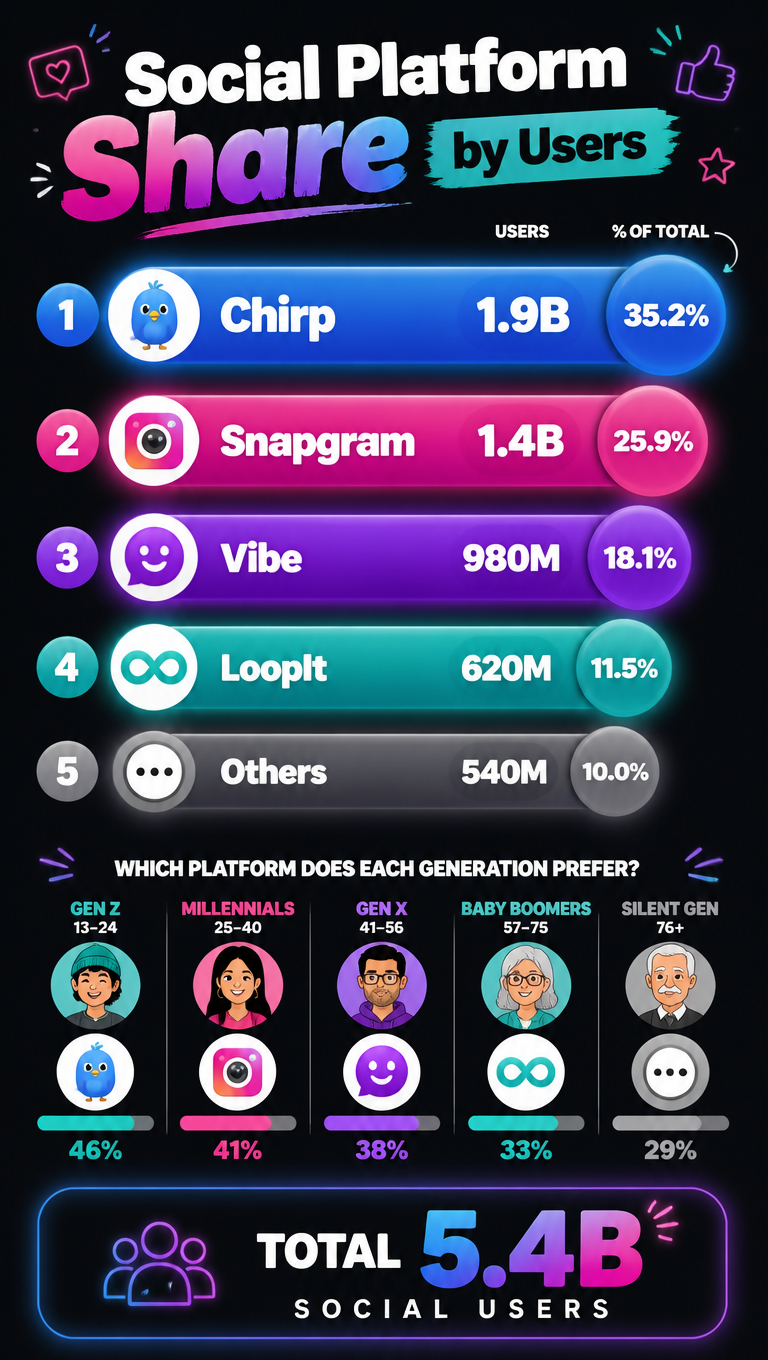
A social-media market-share infographic, 9:16, titled 'Social Platform Share by Users'. A vertical ranked layout: horizontal bubble bars for invented platforms sized by users: Chirp 1.9B (blue), Snapgram 1.4B (magenta), Vibe 980M (purple), LoopIt 620M (teal), Others 540M (grey),

Coffee Chain Market Share
GPT Image 2en

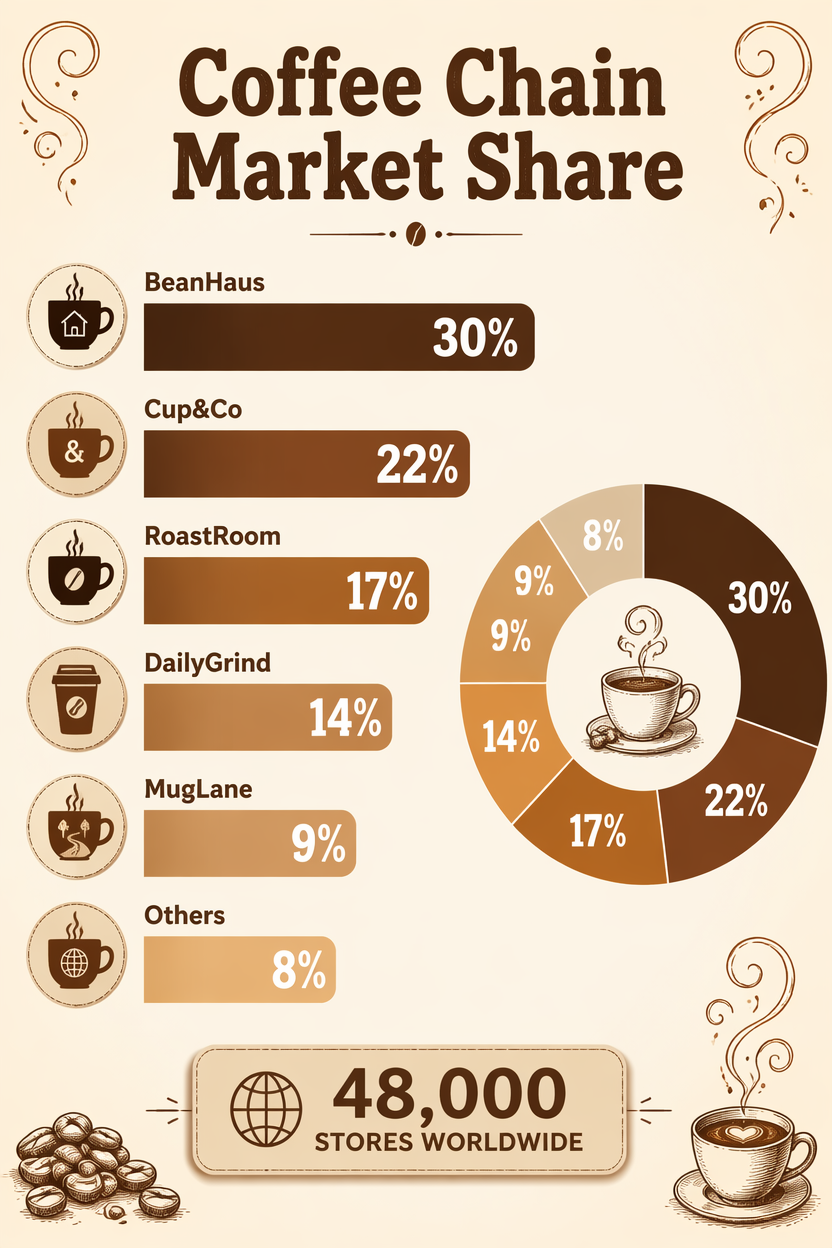
A retail market-share infographic, 2:3, titled 'Coffee Chain Market Share'. A horizontal bar ranking of invented chains: BeanHaus 30%, Cup&Co 22%, RoastRoom 17%, DailyGrind 14%, MugLane 9%, Others 8%, each bar in a warm brown-to-caramel gradient with bold percentages. Small coffe

Cloud Provider Market Share
GPT Image 2en

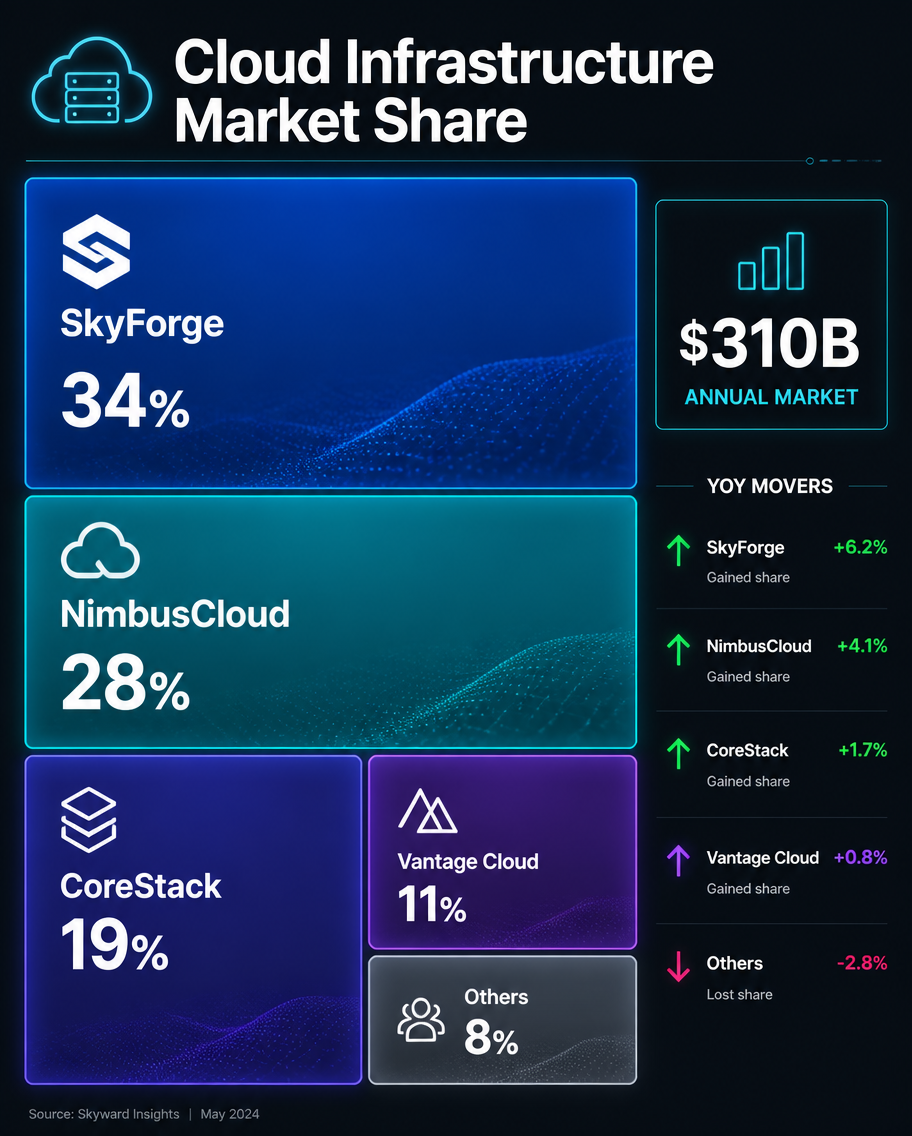
A tech market-share infographic, 4:5, titled 'Cloud Infrastructure Market Share'. A treemap-style block layout sizes invented providers by share: SkyForge 34% (large blue block), NimbusCloud 28% (teal), CoreStack 19% (indigo), Vantage Cloud 11% (purple), Others 8% (grey). Each bl