Original document
GPT Image 2 · en
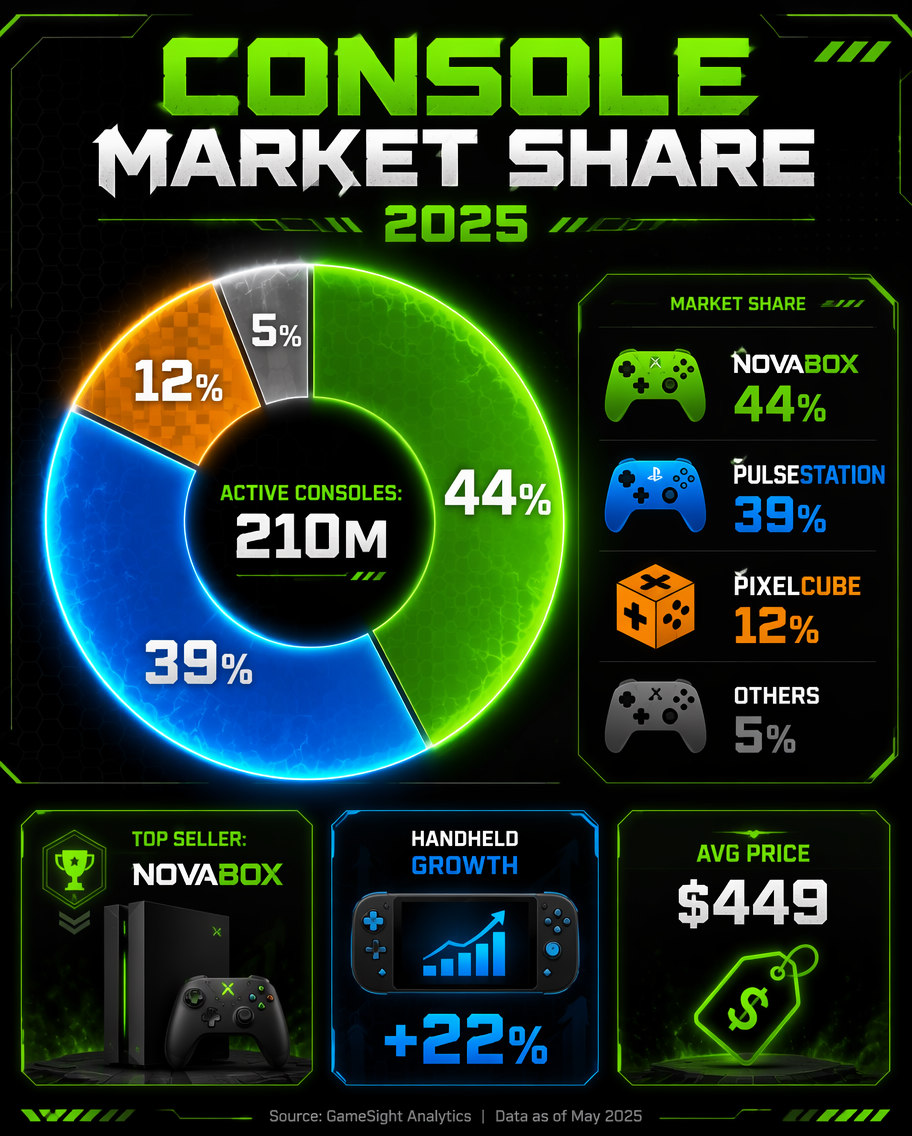
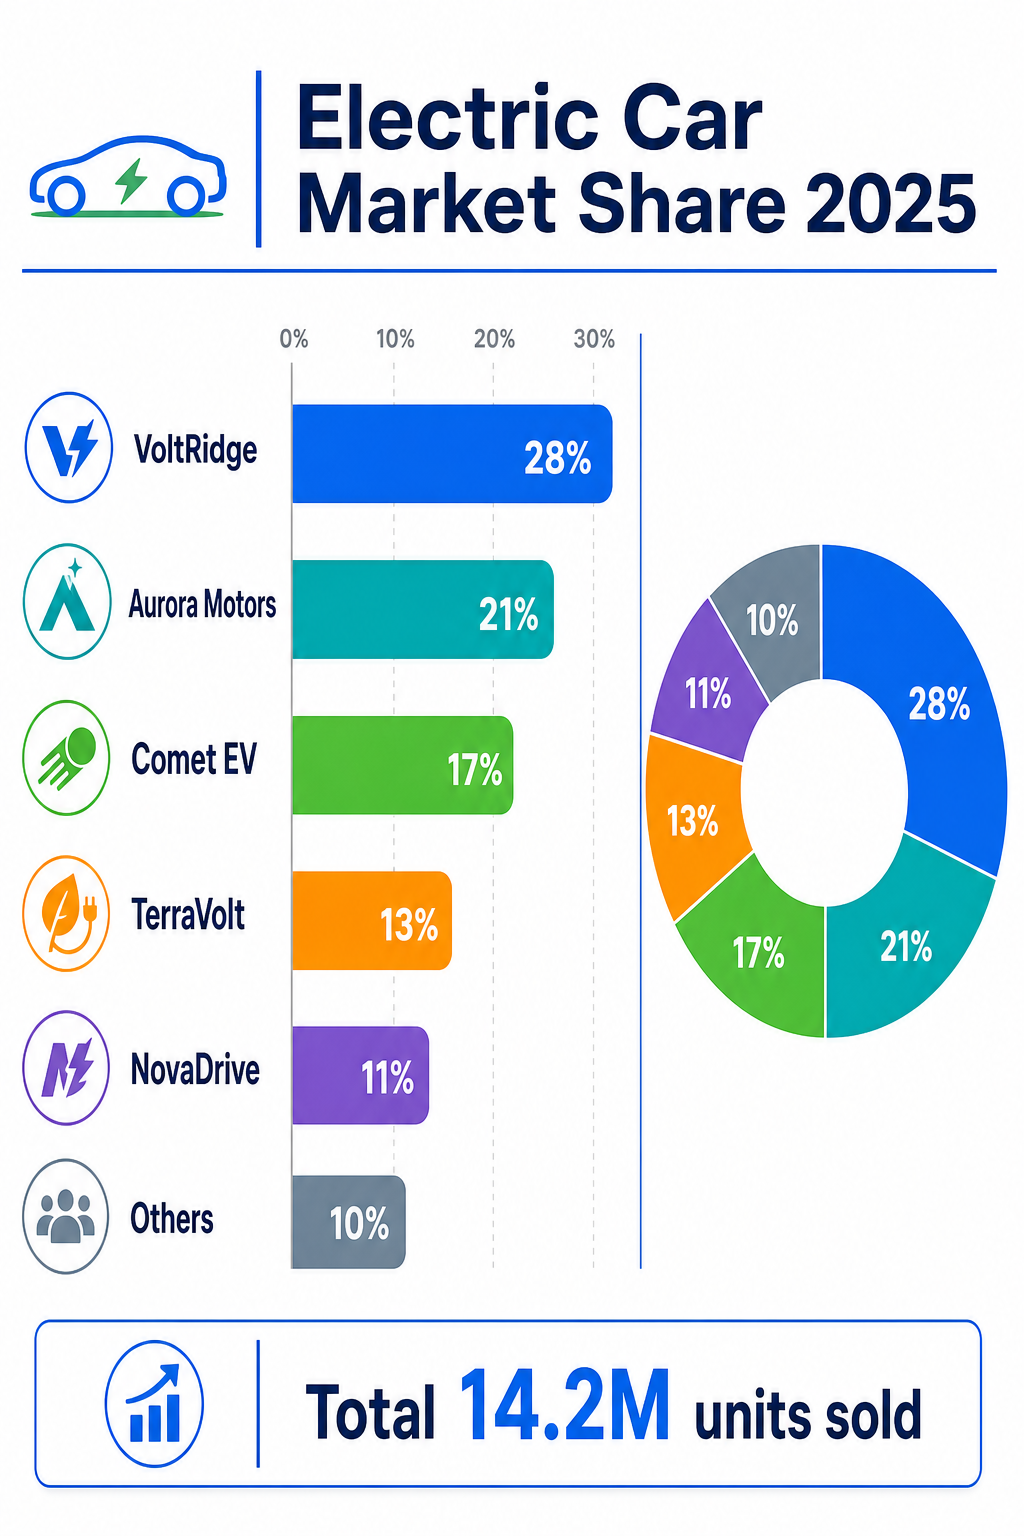
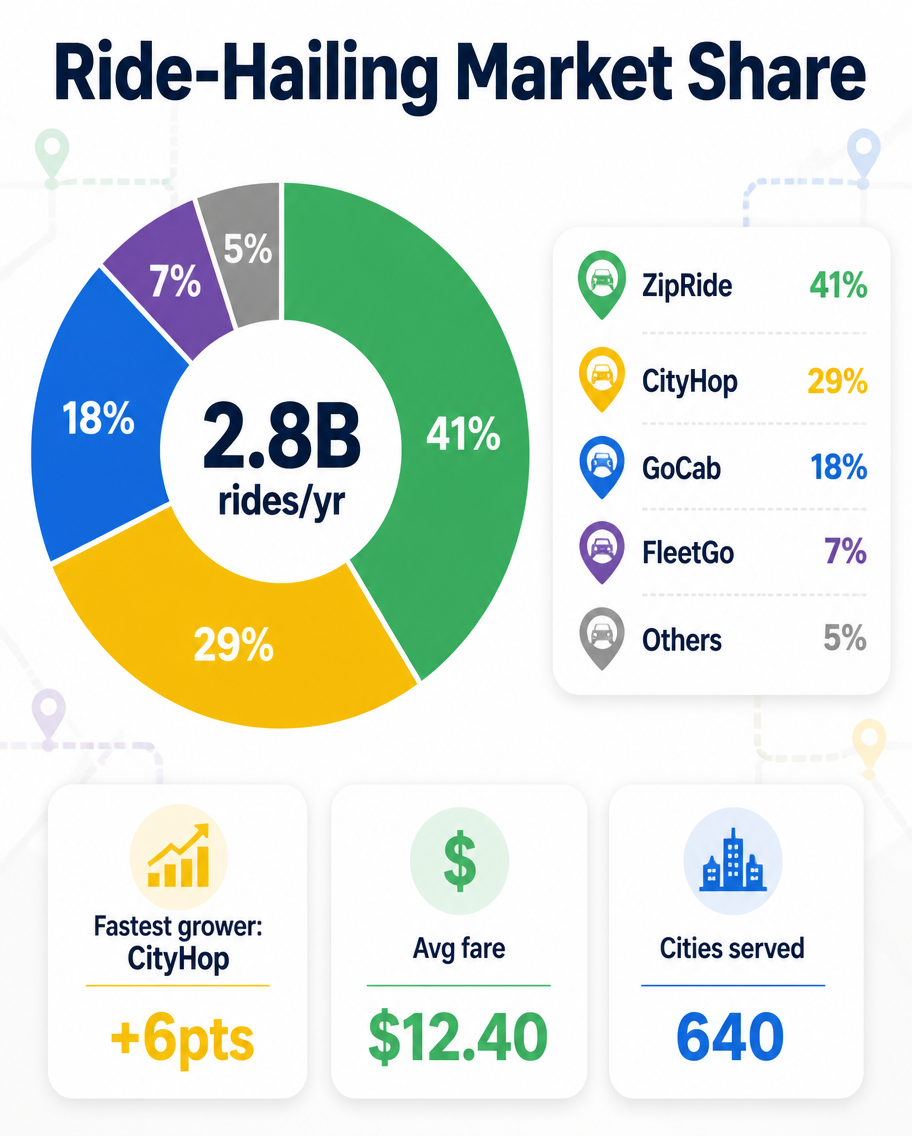
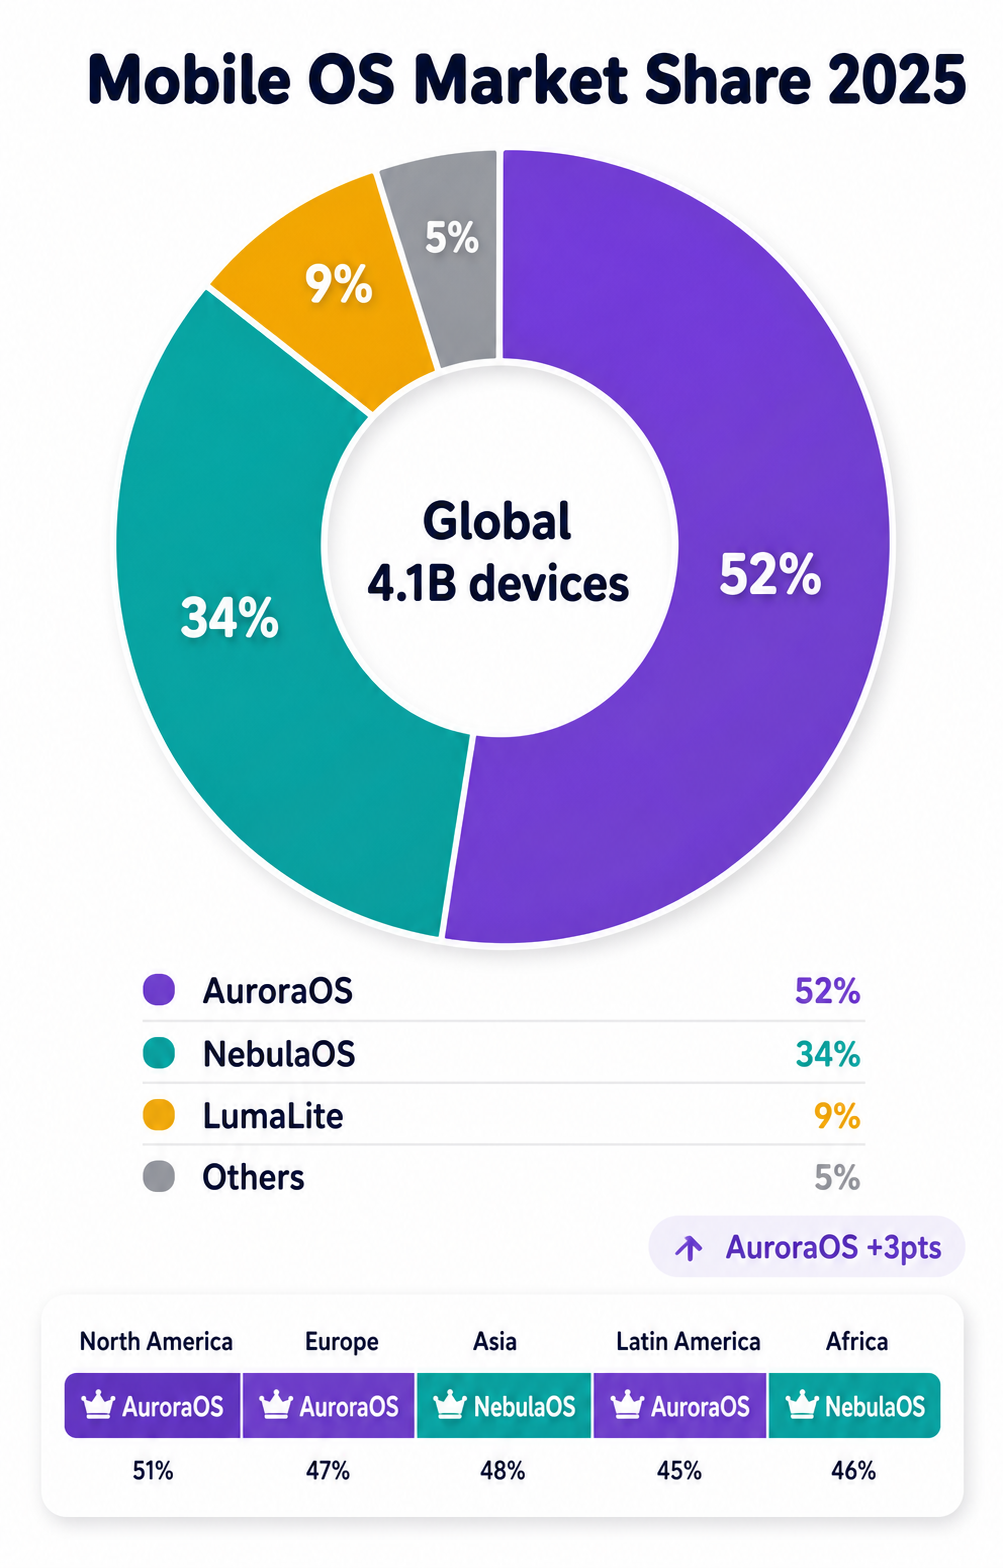
A market-share infographic, 4:5, titled 'Mobile OS Market Share 2025'. A large donut chart splits the market between invented systems: AuroraOS 52% (purple), NebulaOS 34% (teal), LumaLite 9% (amber), Others 5% (grey). The donut center reads 'Global 4.1B devices'. A legend with color dots and exact percentages sits below, plus a small year-over-year change note ('AuroraOS +3pts'). A tiny regional split bar shows differing leaders by continent. Clean white background, flat design, bold rounded headline, subtle shadows, modern data-report aesthetic.How to use
- Copy the complete original prompt, including any parameters.
- Replace the subject, text and composition with your own requirements.
- Use a compatible external tool; check its current access conditions and review the result.
Before you start
- Check whether a reference image is required. A compatible model label does not mean this example was generated with that model.
- Keep names, figures and visible text accurate; results can vary between model versions.